Navigating Advanced Logs in Google BigQuery
Default logs and advanced logs
Addingwell offers two logging systems, depending on the level of detail you need.
- The logs built into the platform give a high-level view of your server-side container’s activity. They surface the error messages returned by third-party APIs (Meta, Google, etc.), without detail on the contents of the requests. They cover most common cases; see Monitoring server-side performance.
- The advanced logs, available on request, give access to the container’s raw activity through a dedicated Google BigQuery dataset, outside the Addingwell interface. By default this dataset only contains failing outgoing requests. Activating advanced logs enriches it to include the detail of successful outgoing requests, as well as the full incoming requests (
tagging_requests).
To request activation of the advanced logs, contact [email protected]. Activation lasts 30 days, is not retroactive (only events occurring after activation are available), and needs to be renewed once it expires.
What the Google BigQuery dataset contains
The dataset (referred to below as <your-dataset>) exposes several tables. Most of your investigations will use the following:
| Table | Contents | Default logs | Advanced logs |
|---|---|---|---|
tagging_outgoing_requests | One row per outbound HTTP call to vendors (Google Analytics, Meta, Snapchat, …): full URL, headers, body and response. | Failures only | Failures + successes |
tagging_requests | One row per hit received by the server-side container: full URL, headers, body and the response returned to the browser. | ❌ | ✅ |
gtm_monitoring | Per-event tracking of tag firings: status, execution time, per-vendor consent decision, and the raw event data. | ✅ | ✅ |
gtm_tags | Catalog of GTM tag definitions versioned over time (id, name, template, paused state). | ✅ | ✅ |
The following tables are internal or for reference, and are rarely needed during an investigation:
| Table | Contents | Default logs | Advanced logs |
|---|---|---|---|
incoming_requests | One row per hit received, with hashed identifiers and metadata only (origin/host check, ad-blocker detection), without headers or body. | ✅ | ✅ |
didomi_vendor_registry | Reference table mapping a Didomi vendor_id to its readable name. | ✅ | ✅ |
Prerequisites
To run queries against the BigQuery dataset you need:
- An account associated with GCP (Gmail addresses qualify natively; others, e.g. Outlook, must first be linked to a Google account) that is also a member of the Addingwell container.
- A BigQuery project associated with that account, to be able to run queries on the dataset.
- BigQuery access granted from Addingwell (see next section).
Granting BigQuery access
You must have the Admin or Owner role on the container to grant or revoke BigQuery access, to yourself or to another user.
- In Addingwell, open the Team section in the bottom-left navigation.
- Click the three-dot menu on the right of the user you want to grant access to.
- Select Grant BigQuery Access.
- A purple icon of a magnifying glass appears, indicating that the user now has rights to access the logs
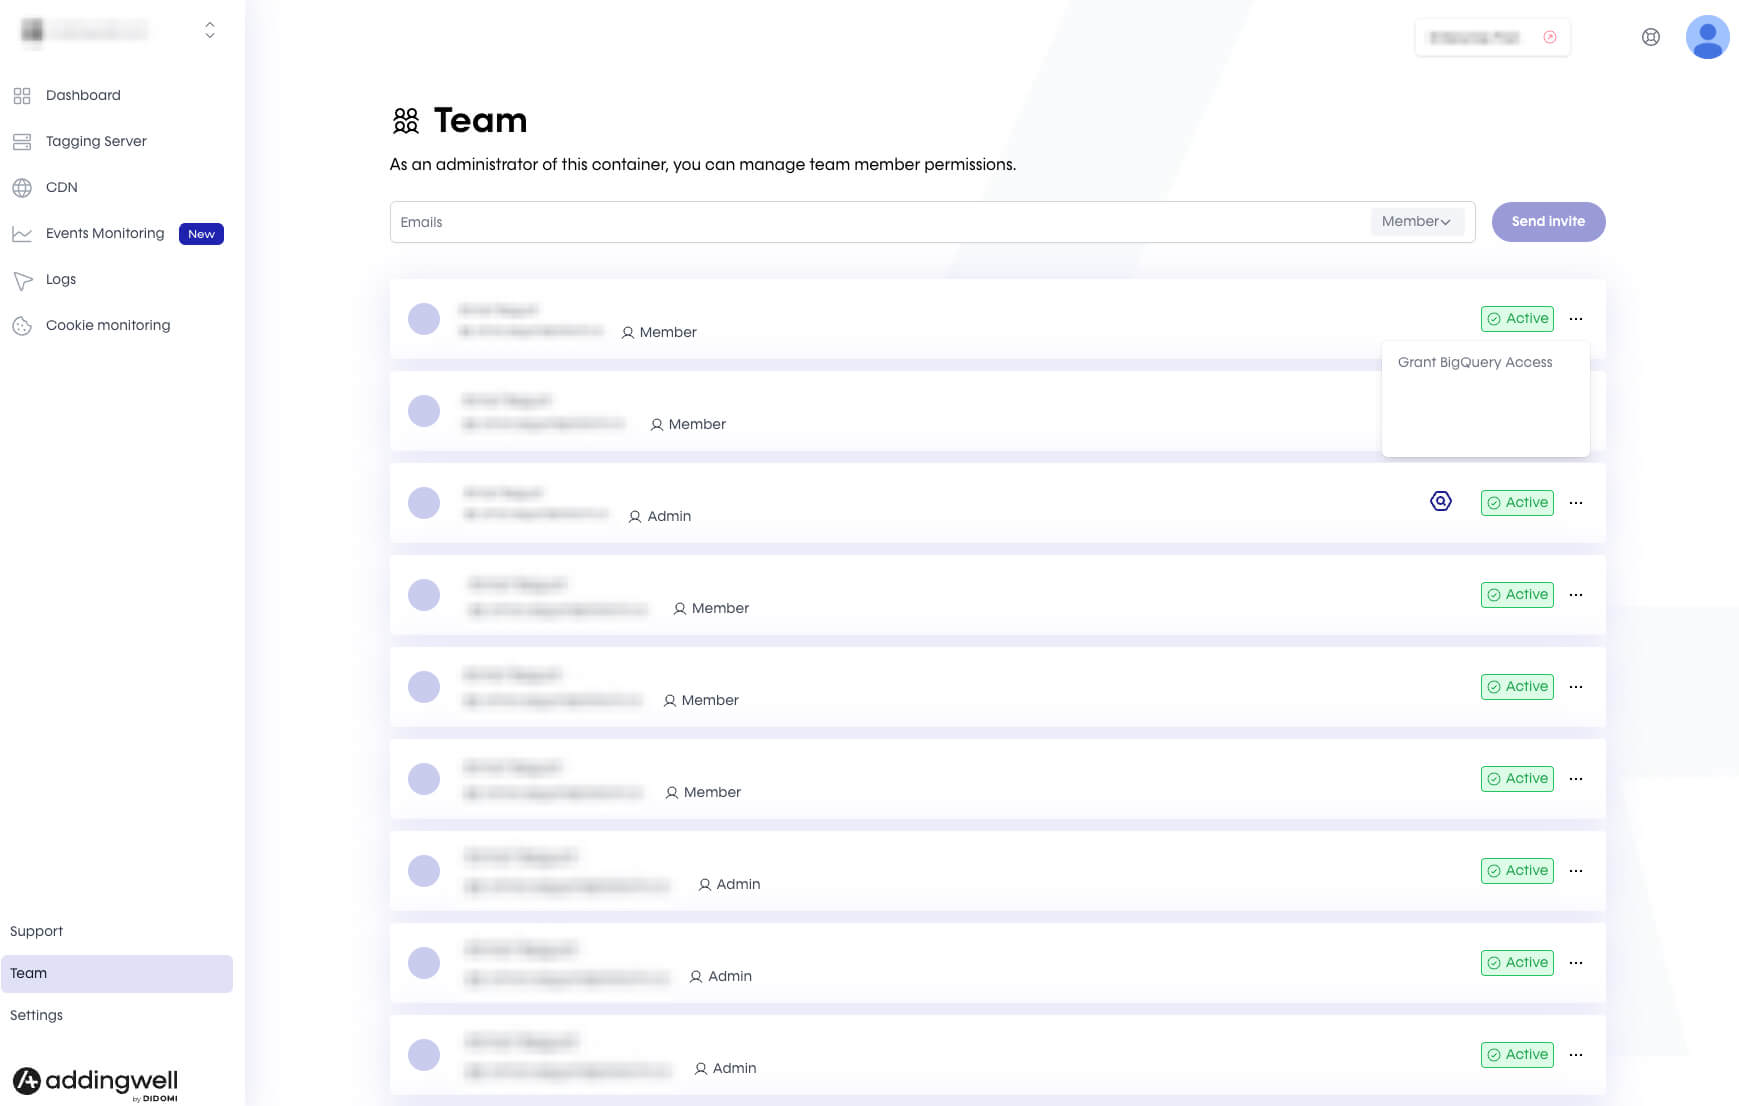
To revoke access, follow the same steps: the Grant BigQuery Access option is replaced by Remove BigQuery Access.
- Click on the purple icon to be redirected to the BigQuery tables.
Running a query also requires a Google Cloud project selected in BigQuery. Any project on your own account works (it is only used to run the query, not to store the logs); if you don’t have one, create it in the Google Cloud console first.
Where to run queries
Once on BigQuery, open your dataset, click + Compose new query (or the + next to existing tabs), paste a query below, and hit Run.
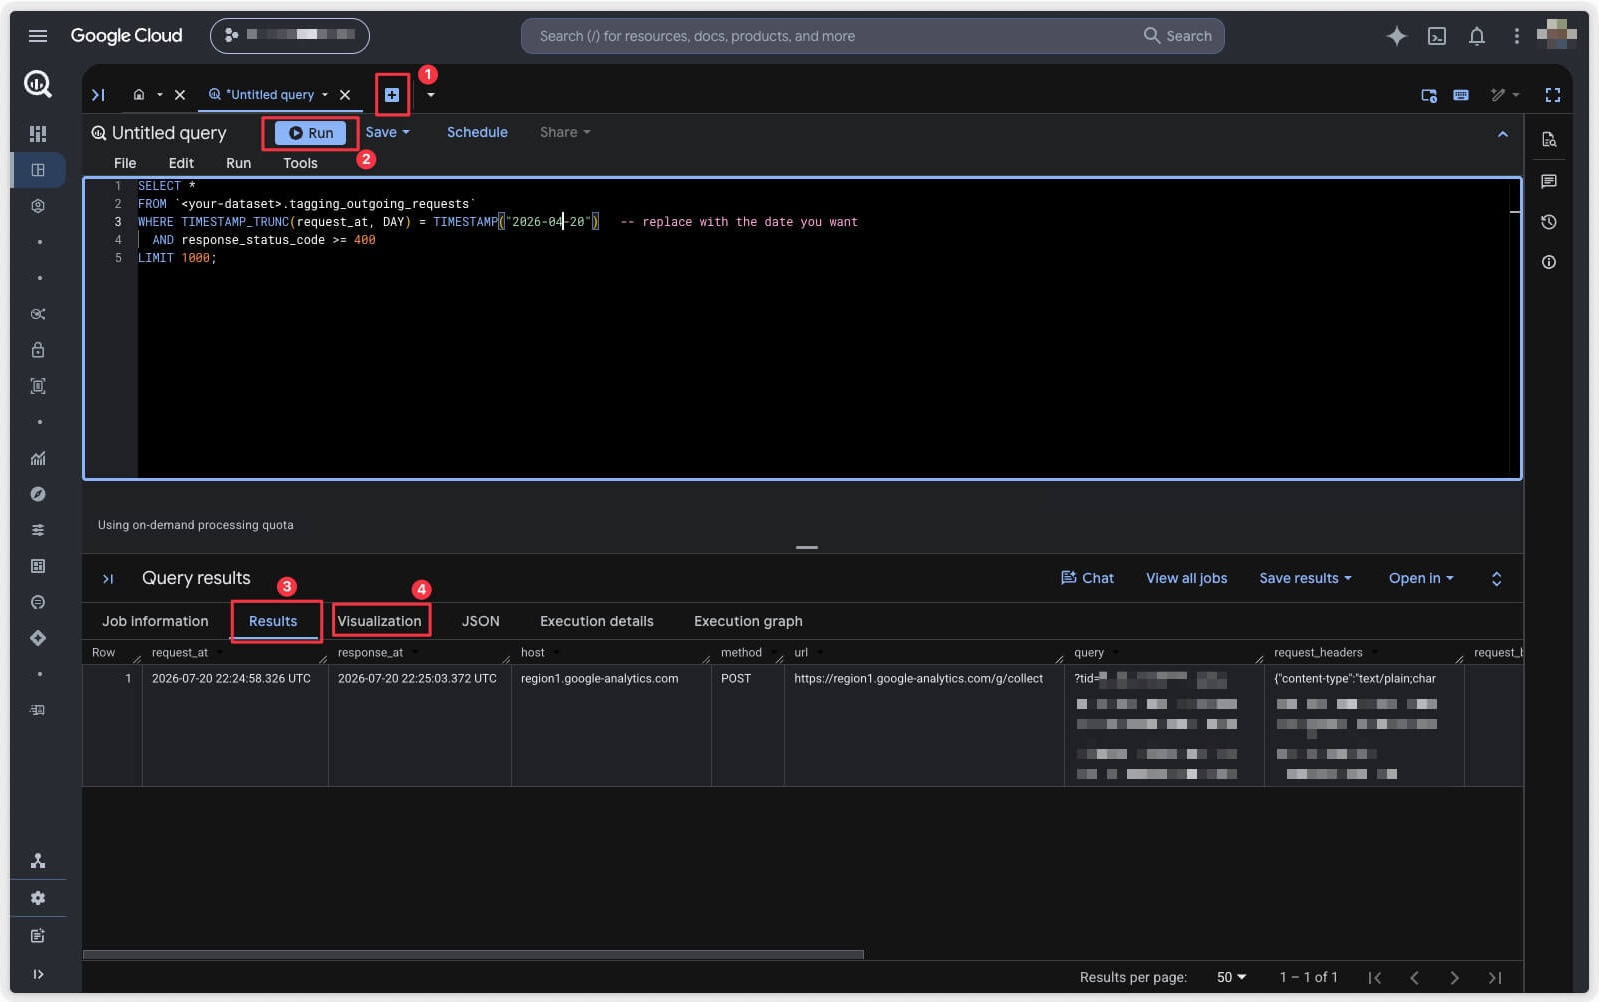
- New query: click the + to open a fresh query tab, then paste your query into the editor.
- Run: executes the query; the on-demand processing quota it used is shown just below the editor.
- Results: the default view of the returned rows, one column per field.
- Visualization: turns the result set into a quick chart without leaving BigQuery, which can be useful for some queries (see for example #4 in the next section).
<your-dataset> in the examples is a placeholder for your project and dataset: replace it with what the BigQuery explorer shows once you arrive via the purple icon, following a pattern like prod_environment.clientname_raw (so a full table reference reads prod_environment.clientname_raw.tagging_outgoing_requests).
Most tables are partitioned on their timestamp column: we recommend a WHERE clause on request_at / event_timestamp in every query to keep it fast and cheap.
Common use cases
This section collects a few common use cases that should prove useful. The queries are intentionally simple: for specific cases you may need additional filtering (by event, nested subqueries, etc.).
Expand any query below to see the details.
1. Show your failing outgoing requests
By default the export already contains only failing outgoing requests, so this is the quickest first look at what is erroring.
SELECT *
FROM `<your-dataset>.tagging_outgoing_requests`
WHERE TIMESTAMP_TRUNC(request_at, DAY) = TIMESTAMP("2026-04-20")   -- replace with the date you want
  AND response_status_code >= 400
LIMIT 1000;
2. Inspect a vendor’s failing payload
When a vendor rejects a call, the useful detail is inside request_body. This pulls the key event fields straight out of a Meta (CAPI) payload so you can spot the malformed one. The JSON paths are Meta-specific; adapt them for other vendors.
SELECT
  request_at,
  JSON_VALUE(request_body, "$.data[0].event_name") AS event_name,
  JSON_VALUE(request_body, "$.data[0].event_source_url") AS event_source_url,
  JSON_VALUE(request_body, "$.data[0].custom_data.currency") AS currency,
  JSON_VALUE(request_body, "$.data[0].custom_data.value") AS value
FROM `<your-dataset>.tagging_outgoing_requests`
WHERE host LIKE "%facebook%"                                      -- replace with the vendor you investigate
  AND TIMESTAMP_TRUNC(request_at, DAY) = TIMESTAMP("2026-04-20")  -- replace with the date you want
  AND response_status_code >= 400
LIMIT 1000;
3. Plot success vs. error rate per day for a vendor
Useful for confirming whether an error is a one-off spike or a sustained issue. Replace host with the vendor you’re investigating. Further filters (for example on a specific event or endpoint) can help you narrow down the investigation.
SELECT
  TIMESTAMP_TRUNC(request_at, DAY) AS time_bucket,
  COUNTIF(response_status_code = 200) AS success_count,
  COUNTIF(response_status_code >= 400) AS error_count,
  SAFE_DIVIDE(COUNTIF(response_status_code >= 400), COUNT(*)) * 100 AS error_rate_pct
FROM `<your-dataset>.tagging_outgoing_requests`
WHERE request_at >= "2026-04-20"   -- replace with your start date
  AND host LIKE "%facebook%"       -- replace with the vendor you investigate
GROUP BY time_bucket
ORDER BY time_bucket ASC;
4. Consent Mode breakdown by day
Counts events per Google Consent Mode state per day, with the share of each. G111 = fully granted, G100 = fully denied; G110 / G101 are partial states, and empty/undefined means no signal was recorded.
SELECT
  TIMESTAMP_TRUNC(event_timestamp, DAY) AS day,
  SUM(IF(consent_settings LIKE '%G111%', 1, 0)) AS consent_G111,
  SUM(IF(consent_settings LIKE '%G110%', 1, 0)) AS consent_G110,
  SUM(IF(consent_settings LIKE '%G101%', 1, 0)) AS consent_G101,
  SUM(IF(consent_settings LIKE '%G100%', 1, 0)) AS consent_G100,
  SUM(IF(consent_settings = "" OR consent_settings IS NULL, 1, 0)) AS consent_undefined,
  ROUND(SUM(IF(consent_settings LIKE '%G111%', 1, 0)) / COUNT(*) * 100, 2) AS rate_G111,
  ROUND(SUM(IF(consent_settings LIKE '%G100%', 1, 0)) / COUNT(*) * 100, 2) AS rate_G100
  -- add rate columns for G110 / G101 / undefined the same way if needed
FROM `<your-dataset>.gtm_monitoring`
WHERE TIMESTAMP_TRUNC(event_timestamp, DAY) BETWEEN TIMESTAMP('2026-04-01') AND TIMESTAMP('2026-04-30')   -- replace with your period
  AND event_name = "purchase"        -- replace with the event you want
GROUP BY day
ORDER BY day;
For a single total over the whole period instead of a daily breakdown, remove the day column and the GROUP BY.
5. Detect bots by user-agent and IP
Groups incoming hits by user-agent and forwarded IP. A single agent or IP responsible for a huge share of hits is usually a bot. This reads the full incoming requests, so it needs tagging_requests (advanced logs) to be active.
-- Requires the full incoming request logs (tagging_requests); ask support to activate them.
SELECT
  JSON_VALUE(request_headers, "$.user-agent") AS user_agent,
  JSON_VALUE(request_headers, "$.x-forwarded-for") AS x_forwarded_for,
  MIN(request_at) AS first_seen,
  MAX(request_at) AS last_seen,
  COUNT(*) AS hits
FROM `<your-dataset>.tagging_requests`
WHERE TIMESTAMP_TRUNC(request_at, DAY) BETWEEN TIMESTAMP("2026-04-01") AND TIMESTAMP("2026-04-30")   -- replace with your period
GROUP BY user_agent, x_forwarded_for
ORDER BY hits DESC;
6. Look up a tag id by name
gtm_monitoring only stores tag ids. To find the id from the name (e.g. “Meta CAPI Purchase”), query the latest version of gtm_tags:
SELECT tag_id, name, is_paused, template_name
FROM `<your-dataset>.gtm_tags`
WHERE CAST(version_id AS INT64) = (
  SELECT MAX(CAST(version_id AS INT64))
  FROM `<your-dataset>.gtm_tags`
)
AND name LIKE "%Meta%CAPI%"   -- replace with (part of) your tag name
ORDER BY name;
7. Inspect an incoming GA4 event (e.g. purchase)
Follow a specific GA4 event end to end: this reads the incoming purchase hits and pulls out the key GA4 parameters (measurement id, transaction id, value, currency, consent state) so you can check what actually arrived. It works on both GET and POST hits (request_body or query).
-- Requires the full incoming request logs (tagging_requests); ask support to activate them.
SELECT
  request_at,
  REGEXP_EXTRACT(query, r'(?:^|&)tid=([^&]+)') AS tid,
  REGEXP_EXTRACT(IF(request_body > "", request_body, query), r'(?:^|&)en=([^&]+)') AS event_name,
  REGEXP_EXTRACT(IF(request_body > "", request_body, query), r'(?:^|&)ep\.transaction_id=([^&]+)') AS transaction_id,
  REGEXP_EXTRACT(IF(request_body > "", request_body, query), r'(?:^|&)epn\.value=([^&]+)') AS value,
  REGEXP_EXTRACT(query, r'(?:^|&)cu=([^&]+)') AS currency,
  REGEXP_EXTRACT(query, r'(?:^|&)gcs=([^&]+)') AS gcs
FROM `<your-dataset>.tagging_requests`
WHERE TIMESTAMP_TRUNC(request_at, DAY) = TIMESTAMP("2026-04-20")               -- replace with the date you want
  AND (request_body LIKE "%en=purchase%" OR query LIKE "%en=purchase%")        -- replace purchase with your event
ORDER BY request_at;
8. Regex helpers
Small snippets to pull a value out of request_body or query:
-- Extract a transaction_id from the body
REGEXP_EXTRACT(request_body, r'ep\.transaction_id=([^&]+)') AS transaction_id

-- Extract a header from the request_headers JSON column
JSON_VALUE(request_headers, "$.user-agent") AS user_agent
JSON_VALUE(request_headers, "$.x-forwarded-for") AS x_forwarded_for
Tables reference
Tables for your investigations
tagging_outgoing_requests
Every outbound HTTP call the SST container makes to a vendor endpoint (Google, Meta, TikTok, Snapchat, …). This is the table you’ll use most when debugging tag errors.
| Column | Type | Description |
|---|---|---|
request_at | TIMESTAMP | Date of the outgoing request (partition key). |
response_at | TIMESTAMP | Date of the response. |
host | STRING | Request host (e.g. graph.facebook.com). |
method | STRING | HTTP method. |
url | STRING | Full URL. |
query | STRING | Request query string. |
request_headers | JSON | Request headers. |
request_body | STRING | Request body (often JSON or URL-encoded). |
response_status_code | INT64 | HTTP status code returned by the vendor. |
response_headers | JSON | Response headers. |
response_body | STRING | Response body. |
Internal & reference tables
These tables power Addingwell features and contain partial or internal reference data; you’ll rarely need them day to day. They are documented here for completeness.
incoming_requests
Technical table: every hit received by the server-side container, before any tag has been processed, metadata only. Identifiers are FarmHash-hashed so no PII is stored in clear.
| Column | Type | Description |
|---|---|---|
request_at | TIMESTAMP | Date of the request (partition key). |
client_id_hashed | INT64 | ClientId hashed in FarmHash. |
master_id_hashed | INT64 | MasterID hashed in FarmHash. |
user_agent_hashed | INT64 | User-Agent header hashed in FarmHash. |
fingerprint | INT64 | Fingerprint hashed in FarmHash. |
origin_domain | STRING | Origin of the request. |
host_domain | STRING | Host of the request. |
same_domain | BOOL | true when origin_domain = host_domain. |
is_client_id_restored | BOOL | Whether the client id had to be restored on this request. |
adblocker_detected | BOOL | Whether an adblocker was detected. |
This table does not contain the request body, query string or headers; it is a technical table. For the full detail of incoming requests, see tagging_requests, available once advanced logs are activated.
If you have a question, contact us at [email protected], we’ll be happy to help!