Monitoring & Performance of Your Server-Side Tracking
Your Server-Side migration is complete, but you’re unsure which indicators to monitor to ensure that your tracking remains 100% optimal in production?
No setup is future-proof, as modifications to your site or tracking can have negative consequences, such as:
- A drop in data volume (unintentional stoppage of adblocker bypass).
- Partial data being sent to your analytics or media platforms (requests with a success rate < 100%).
- Suboptimal media performance (algorithms poorly fed with user data).
It is therefore essential to continue monitoring key indicators to quickly identify potential issues and fix them.
Good news, your Addingwell container contains valuable information that allows you to easily verify:
- That the volume of your tracking requests aligns with your activity (and is therefore consistent with your website traffic).
- That the adblocker bypass is correctly implemented, ensuring you can collect incremental data.
- That your media partners receive all the events configured on your server-side tags (with a 100% success rate for each provider).
- That you are feeding your media providers with high-quality data for their algorithms (user data is correctly transmitted from your GTM Web to your GTM Server).
In this article, discover the key screens of your Addingwell container and the essential indicators to monitor once your Server-Side migration is completed.
Consistent Request Volume & Effective Adblocker Bypass
Through your Dashboard, get a quick and effective overview of:
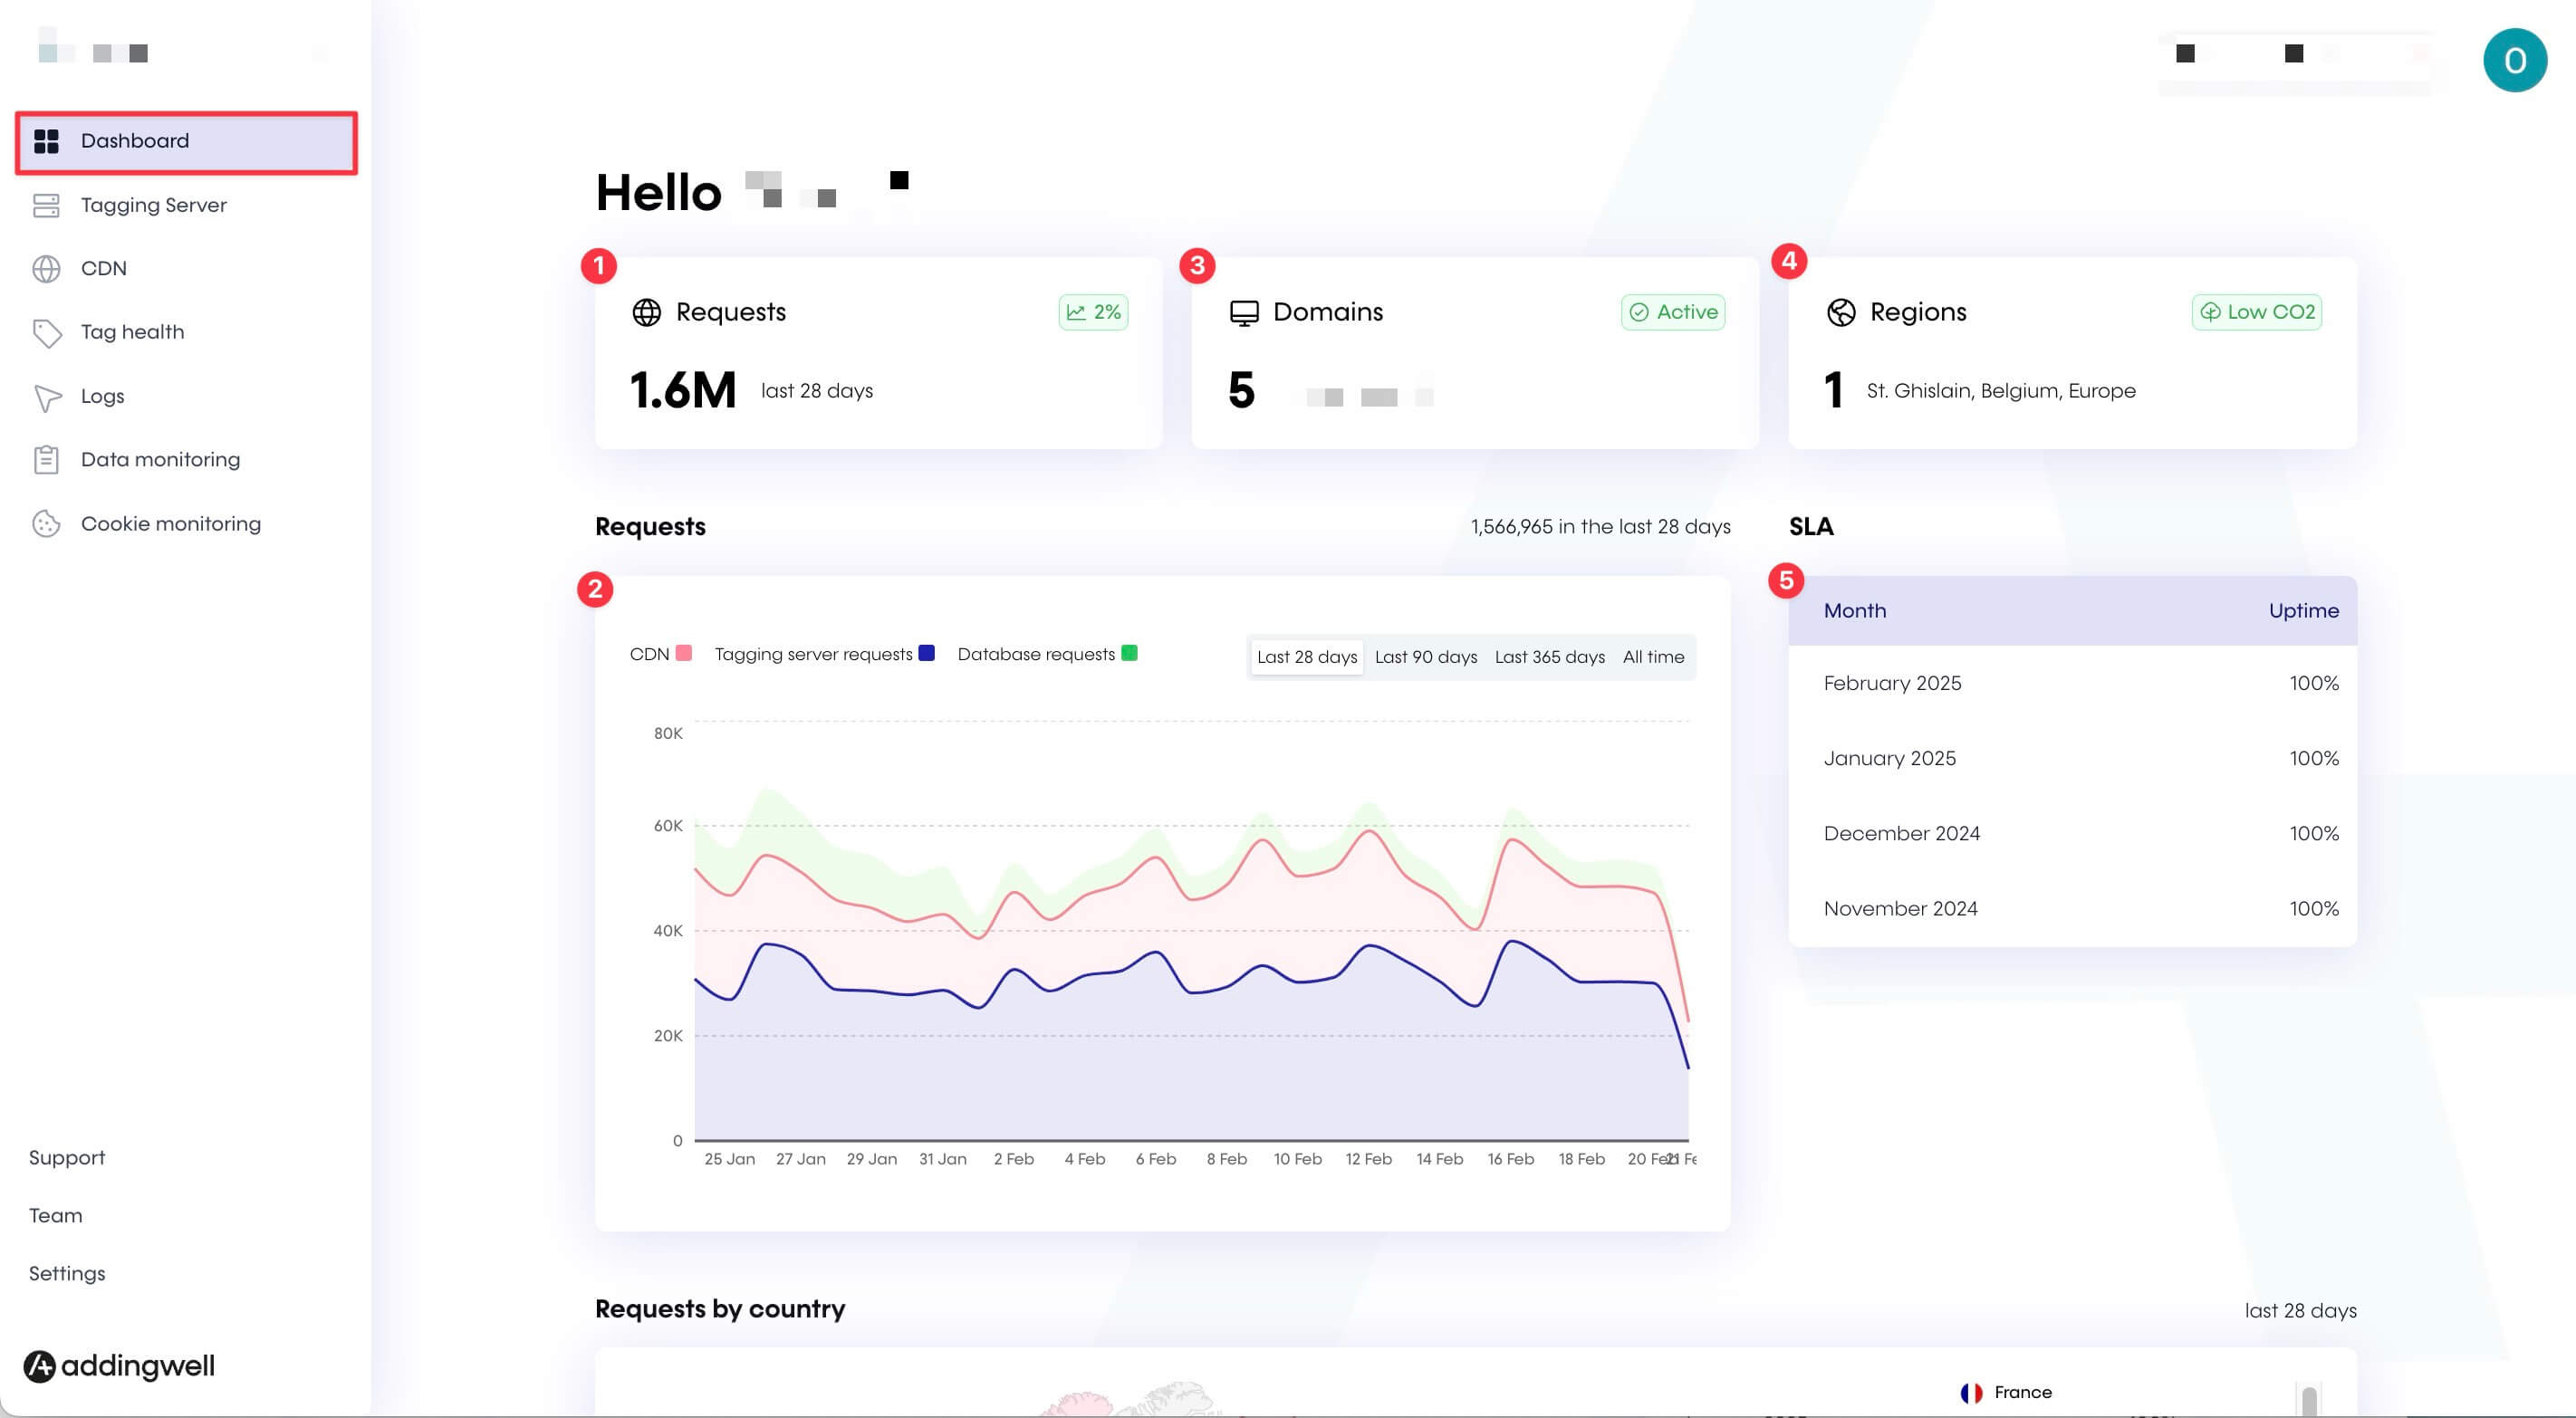
- The volume of requests received by your server over the last 28 days. This provides an initial level of information, but you can see more details in the graphs below.
- The graphs show detailed incoming requests to your server over the last 28 days. You can filter for a longer period (90 days, 365 days, or since your server-side setup began).
- In blue, tagging server requests represent events sent from your GTM Web to your GTM Server. This curve should reflect your website activity, and you can verify whether peaks/spikes in requests align with your traffic.
- In red, additional CDN requests appear if your adblocker bypass is set up and functioning properly. If you don’t see CDN requests, your adblocker bypass is either not working (or has been disabled due to changes on your site), and you simply need to implement the Addingwell alternative snippet.
- In green, additional Database requests appear if you use the Cookie Restore feature to maintain cookies beyond 7 days on Safari.
- The tracking subdomains configured on your container. (Click on the “Domains” card to see the full list or add a new subdomain). If your subdomain is inactive, an error message will appear. In this case, check your DNS records with your hosting provider.
- The number and location of deployed tracking servers.
To maintain optimal performance, it’s crucial that your tracking servers are as close as possible to your users to minimize latency and ensure better responsiveness.
By scrolling down on the Dashboard screen, you can view a map of where your traffic originates from over the last 28 days, helping you decide if adding a server in an additional region is necessary (extra charges apply for an additional zone).
- The availability rate of your Addingwell servers over recent months. Our commitment is simple: to provide a high-performance infrastructure for your servers. This means we guarantee that 99.95% of the time, your servers are available to receive requests.
Events Monitoring: Monitor the Events Sent from Your Server to Your Partners
Events Monitoring is your real-time monitoring tool. It allows you to track the proper distribution of your events to your different media and analytics partners.
Say goodbye to the “black box” effect: you now have real-time visibility into what happens for every tag and event configured server-side. If something goes wrong, you can identify the issue and fix it immediately.
Easily check via Events Monitoring that your events are being sent successfully, with a 100% success rate for each tag you’ve configured on your GTM Server. From the Events Monitoring tab, click on a specific tag to access detailed information for each event sent, including its success/error rate and volume.
Let’s take an example: you want to verify the successful delivery of your events to Meta.
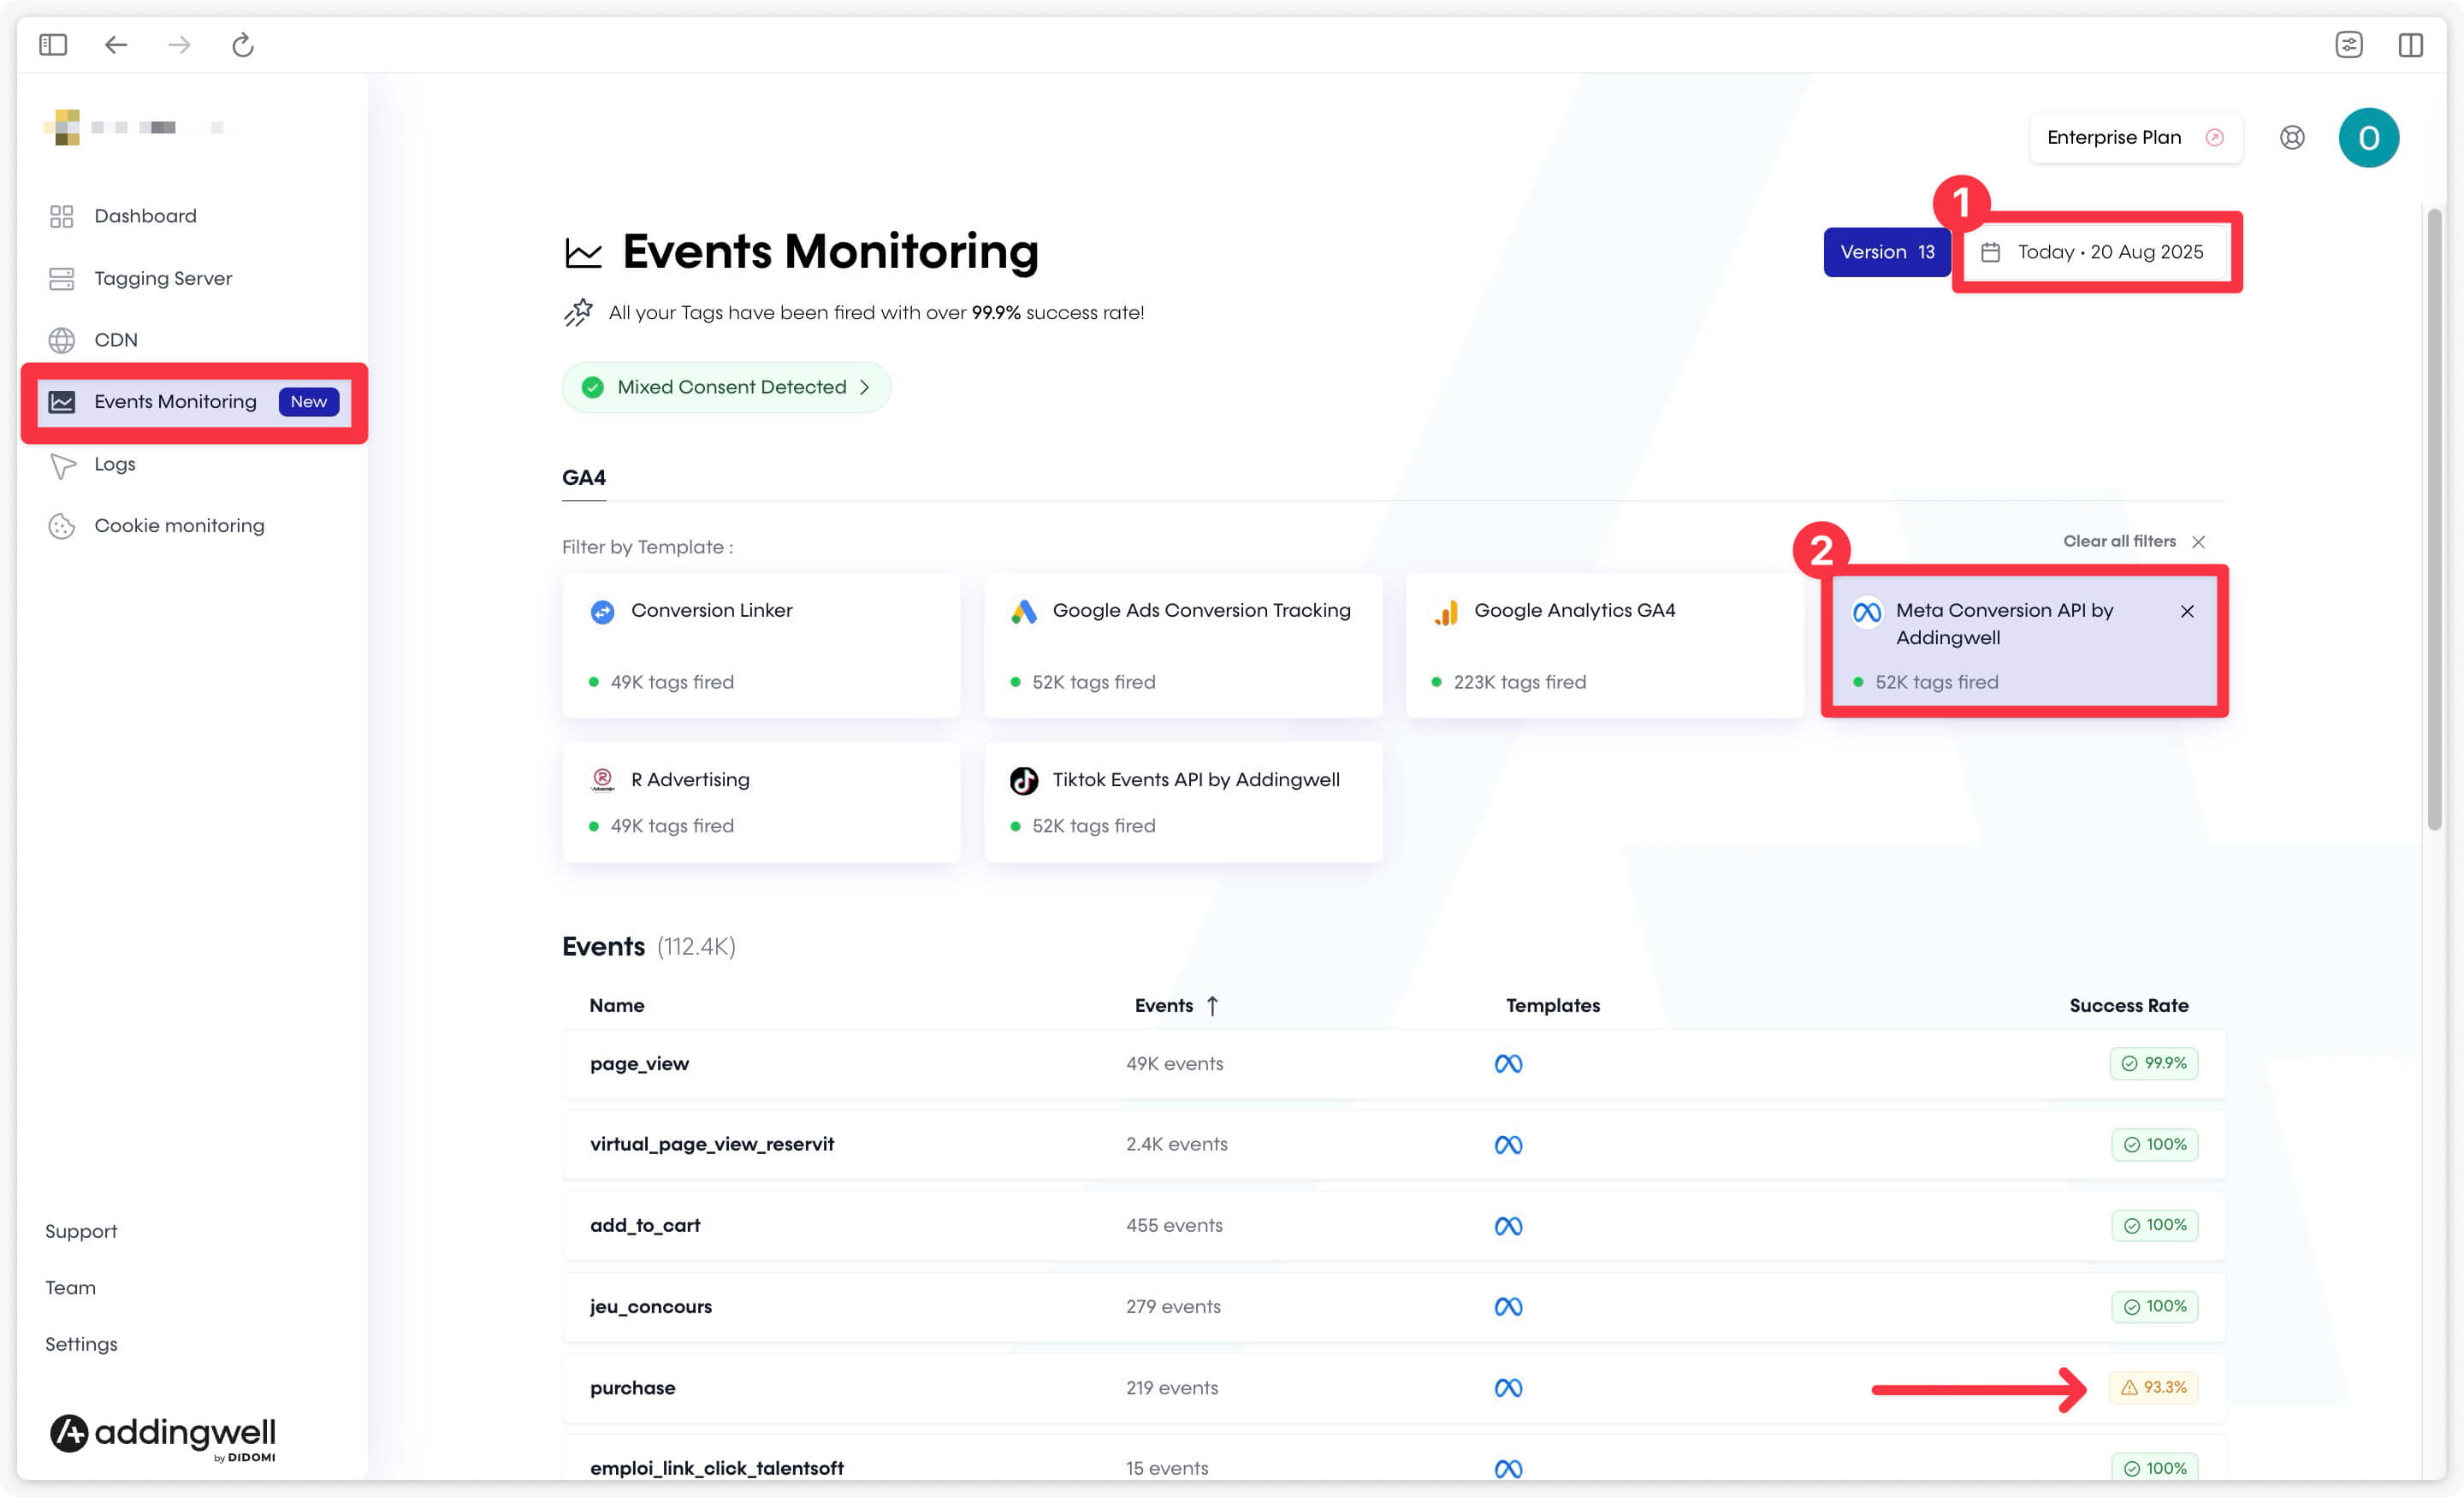
- Select a specific time range using the time filter in the top right corner.
- Click on the Meta tag card to filter the list of events sent to that partner.
- Check whether your events were properly sent to Meta using the success rate for each event. In this example, all events have a 100% success rate except for
purchase, which is only at 93.3%.
When you detect a tag or event that needs fixing, you can dig deeper by reviewing the associated logs to understand what needs to be corrected on your end.
Good to know: an automated alert system is integrated. If a tag does not reach 100% success, all emails linked to the Addingwell container will receive an alert. To avoid spam, only one alert is sent per identical error within a 7-day period.
Events Monitoring: About the “Not Triggered” status
By selecting a specific event, you can access to all the tags fired when this specific event happens. Precisely, you are able to see for each tags, the volume of tags that were fired with three status : Success, Failed or Not Triggered.
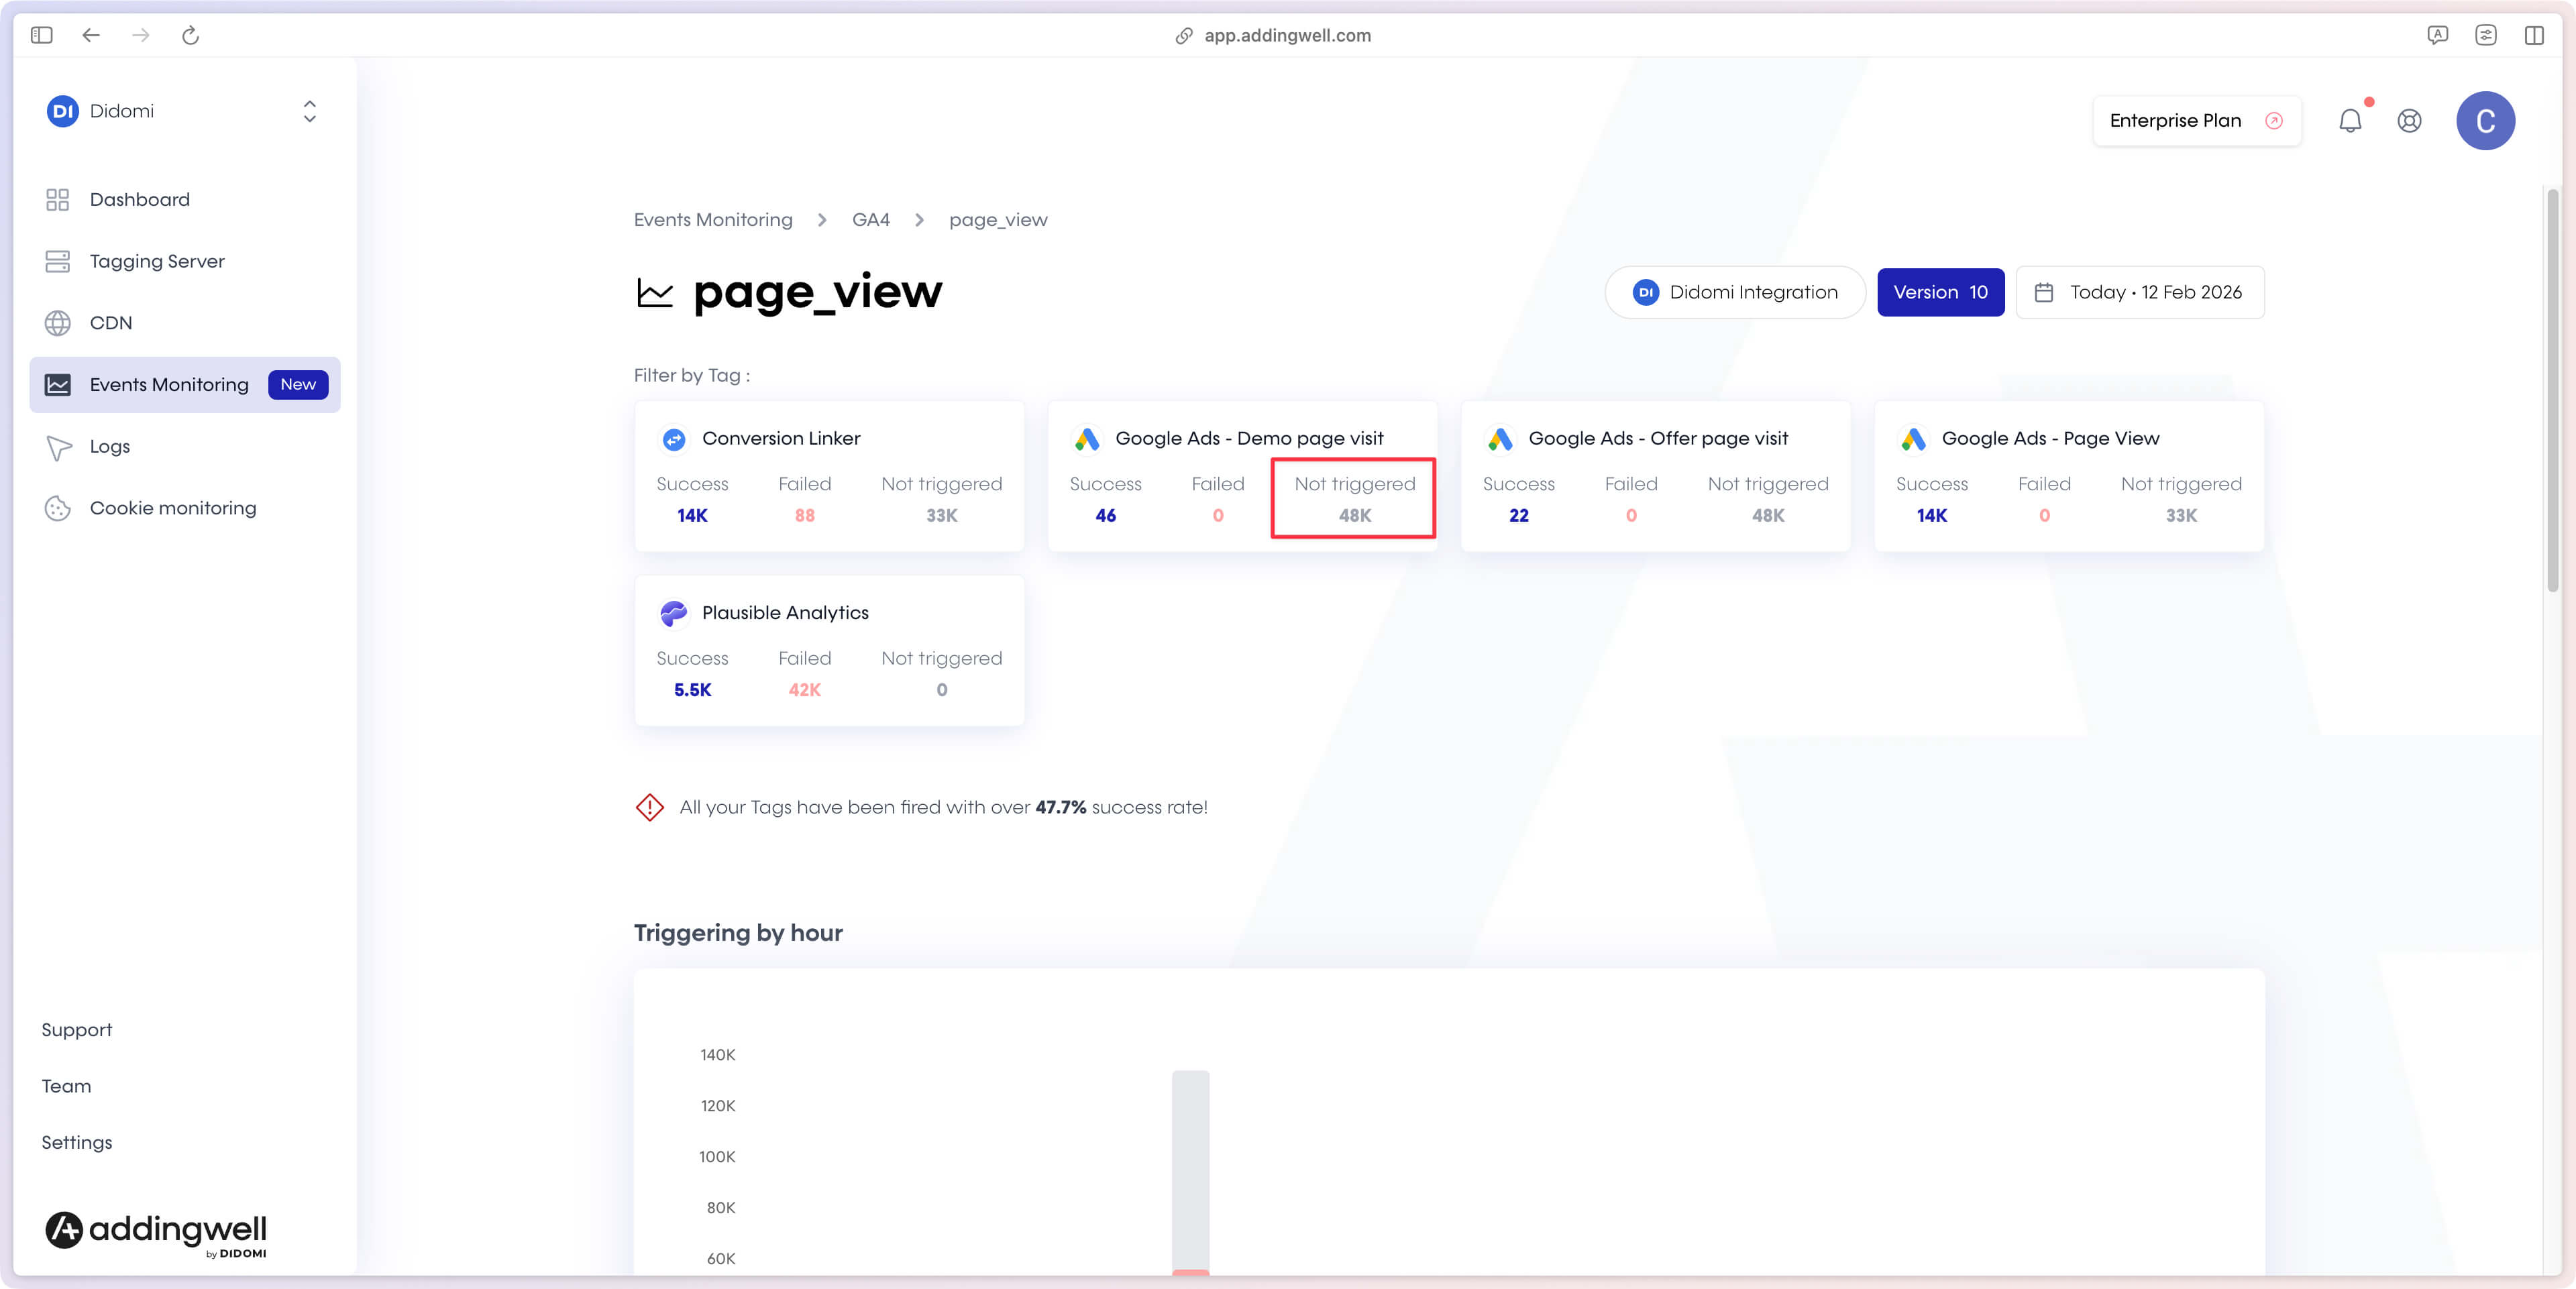
The “Not Triggered” status in the Addingwell platform refers to tags configured in your GTM Server. It indicates that one or more trigger conditions are not met, preventing the tag from firing.
In most cases, the “Not Triggered” status is due to lack of user consent. When the user has not given consent for certain cookie or tracking categories, the associated tags do not fire, even if the other trigger conditions are met.
However, the “Not Triggered” status may also appear in these situations:
- Trigger conditions not satisfied: The criteria defined in the trigger (URL, event, custom variable, etc.) do not match the current situation.
- Trigger exceptions: An exception rule prevents the tag from firing.
- Incorrect configuration: The trigger is misconfigured or incompatible with the execution context.
Logs: Understand Errors in Your Server Requests
Logs can be viewed at any time for each of your server tags, over the time range of your choice. These logs can help guide you in understanding what needs to be corrected in your setup to stop your requests from failing.
Let’s continue with the previous example: the Meta tag, which wasn’t reaching 100% success. From the Logs tab on the left side of your Addingwell container, you can review the available error messages for your Meta tag by clicking on Logs.
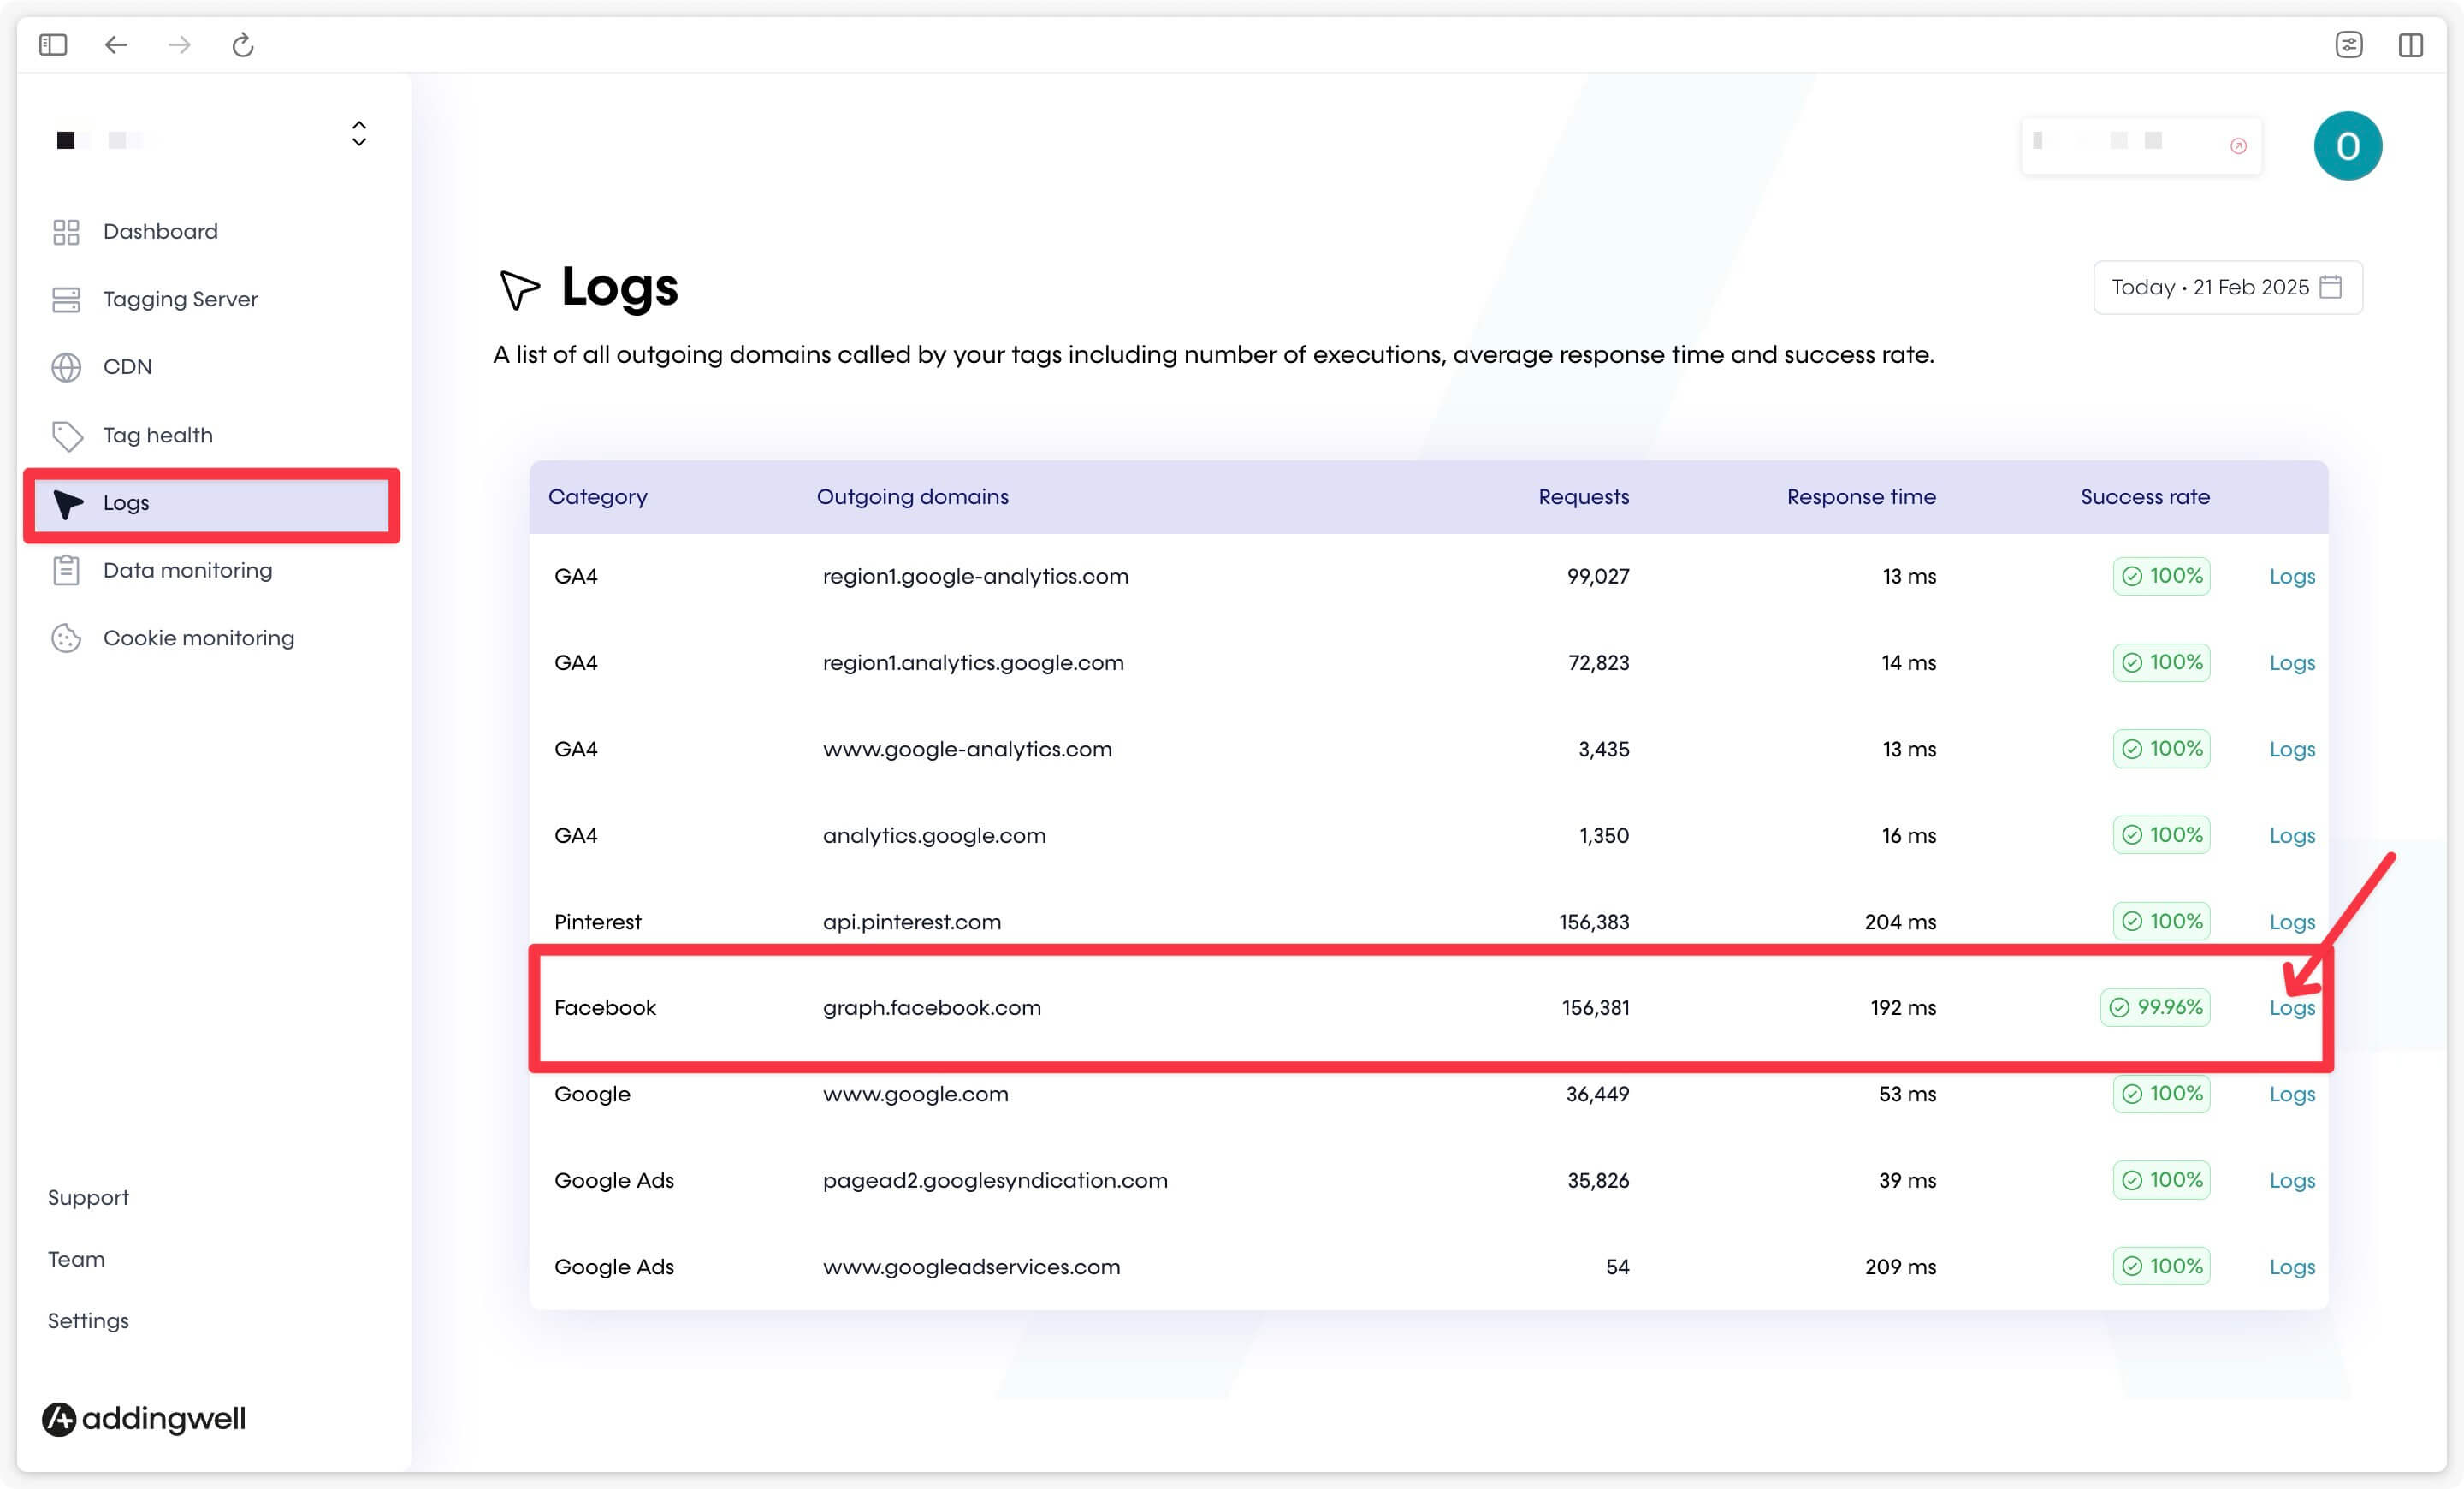
A second, more detailed screen will appear where you can:
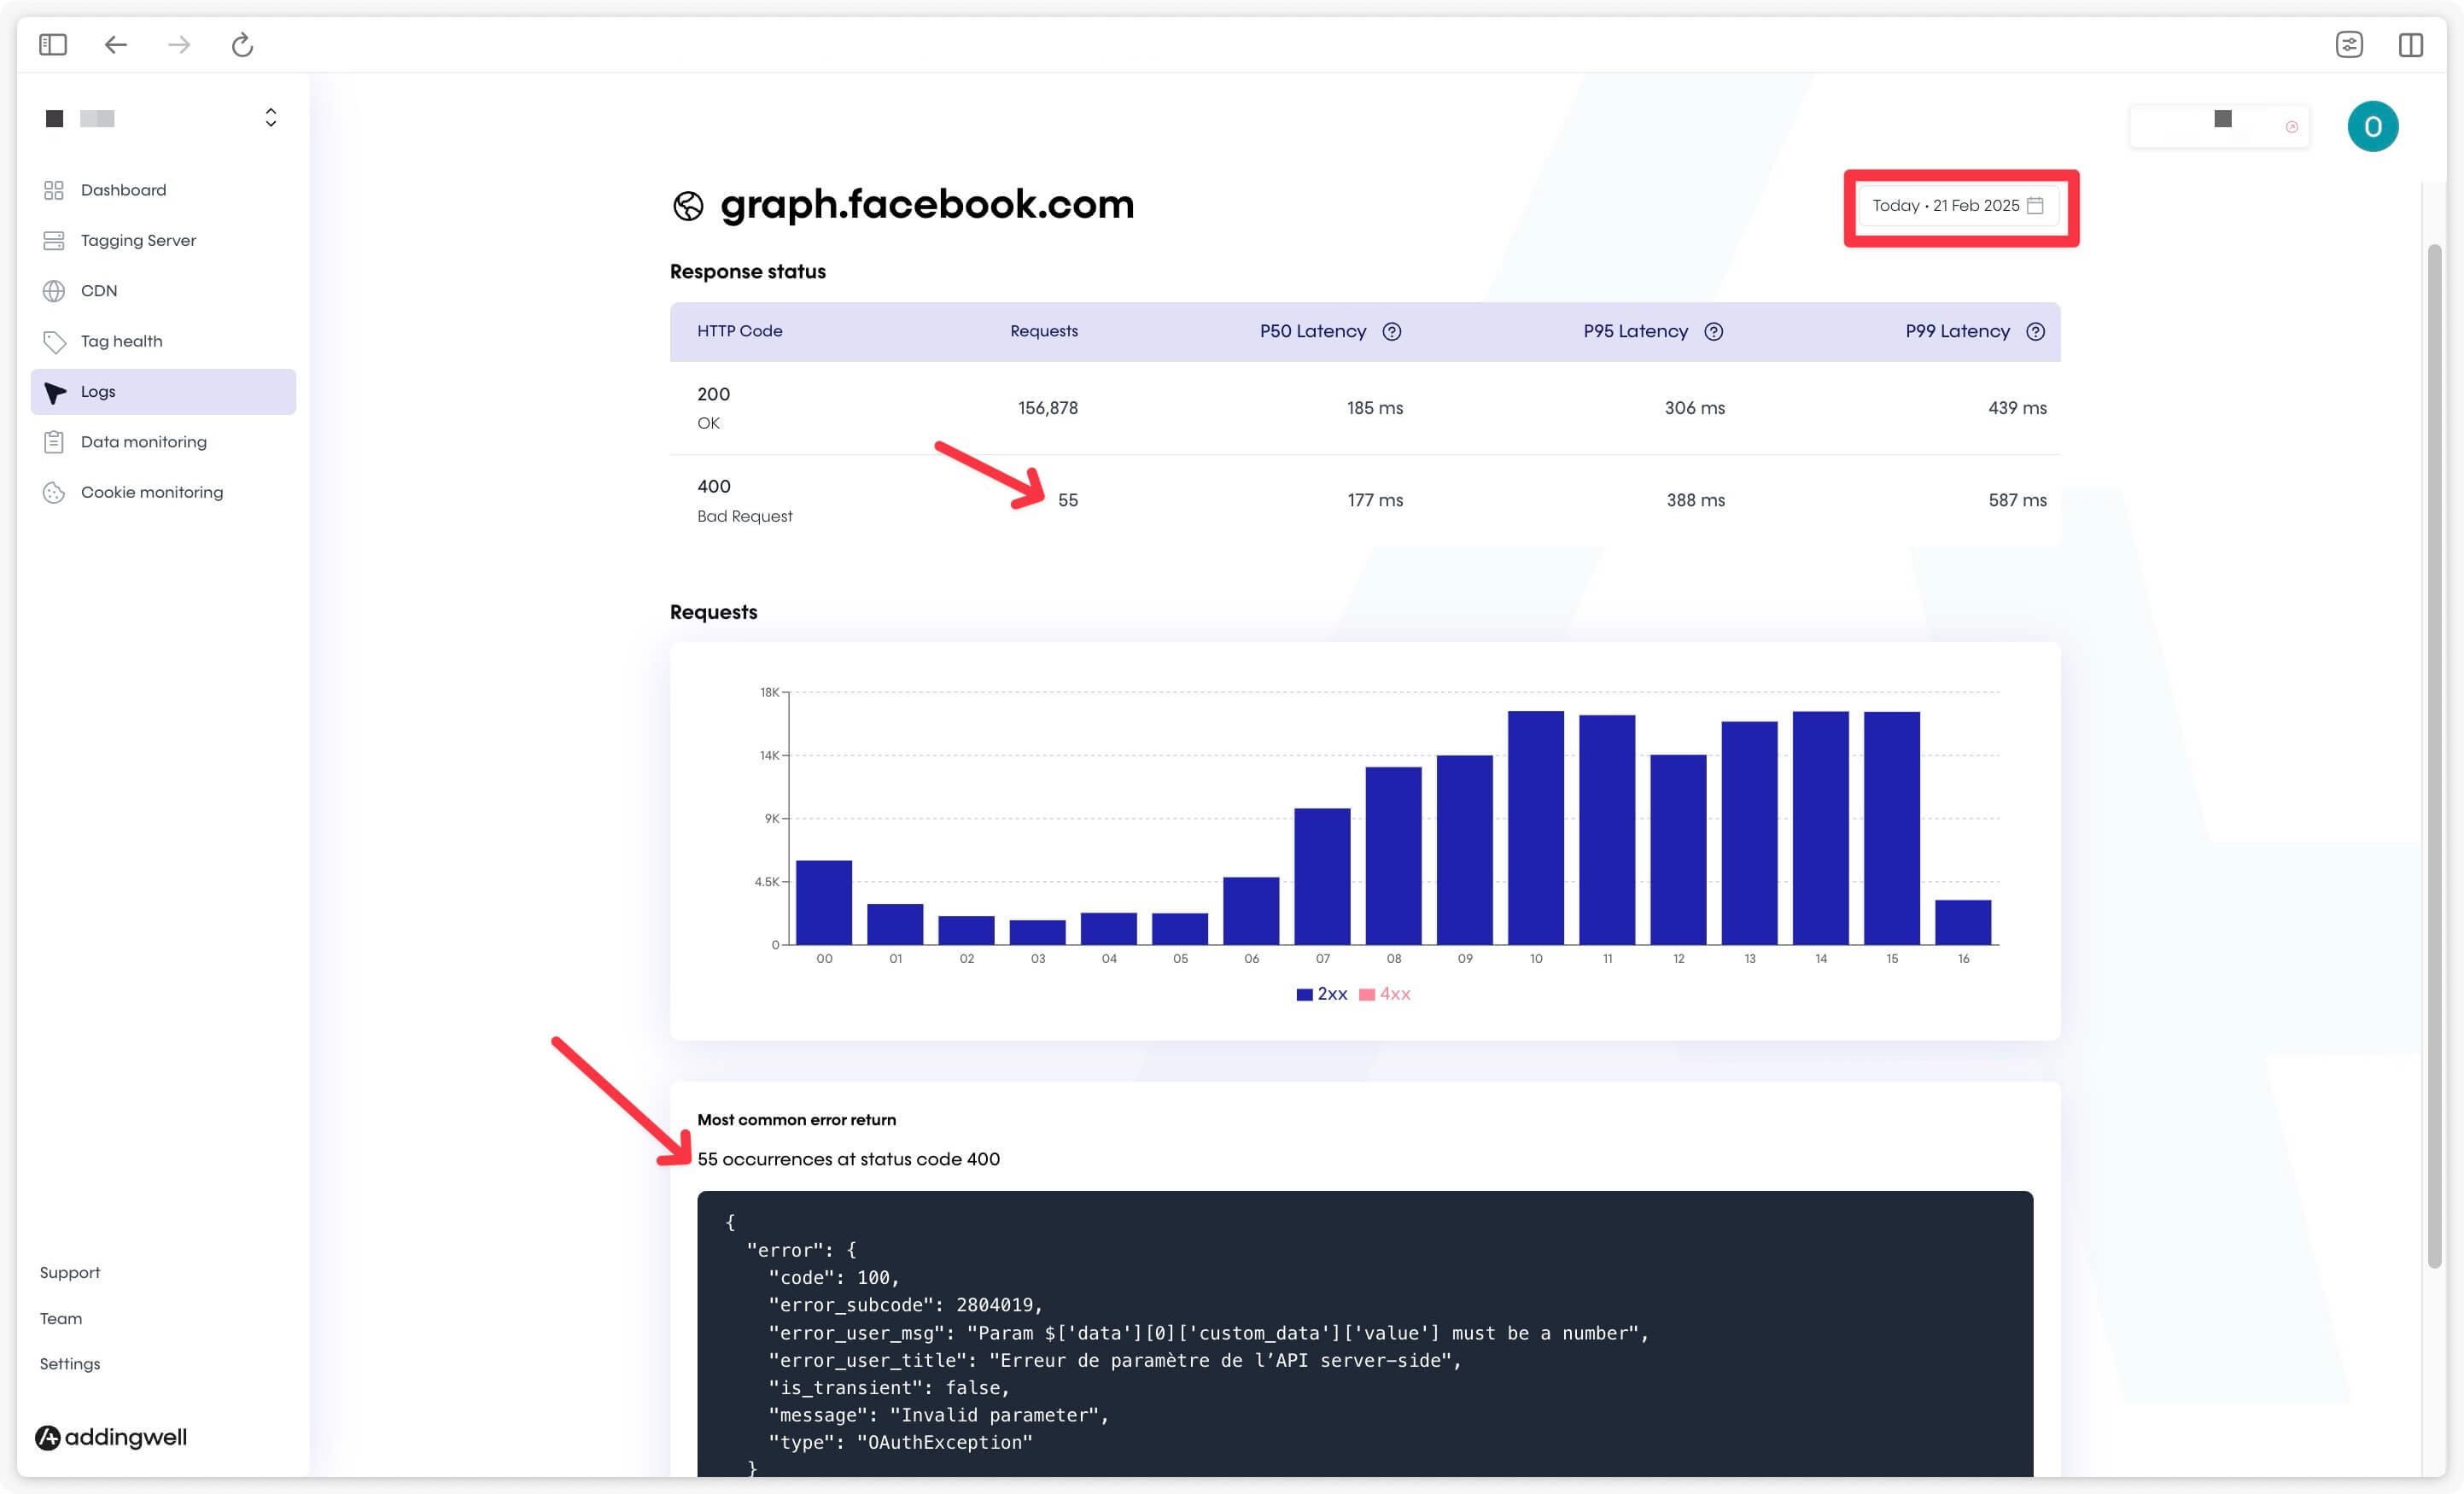
- Filter by the relevant time period (the one where you know your tags weren’t reaching 100% success).
- Check the number of failed requests (in this example: 55 errors with status code 400).
- Review the most frequently returned error message(s) for failed requests. In our case, the value associated with certain products on the website is invalid — it’s not in the correct format (
valueshould be a number, not a text string).
If these error logs aren’t sufficient or clear enough, you can always contact Addingwell’s support team, and we can enable advanced logs in BigQuery tables, giving you access to more in-depth investigations.
Check Parameters Attached to Your Tracking Events, Including User Data
For optimal media campaign performance, it’s crucial to feed your partners’ algorithms with quality data. This means ensuring you attach user data to the events you send (e.g., for advanced conversion tracking with Google, or Quality Match optimization with Meta).
With Events Monitoring, you can easily check the list of parameters attached to events received by your GTM Server. This allows you to verify that a purchase event includes a value, currency, item list… and also all user data linked to the event, such as the user’s email, phone number, first name, last name, etc.
To do so, click on the Events Monitoring tab, then on a specific event to see whether it includes the expected user-data parameters. In the example below, we selected the purchase event, and we can see that the email address is present in only 2% of cases.
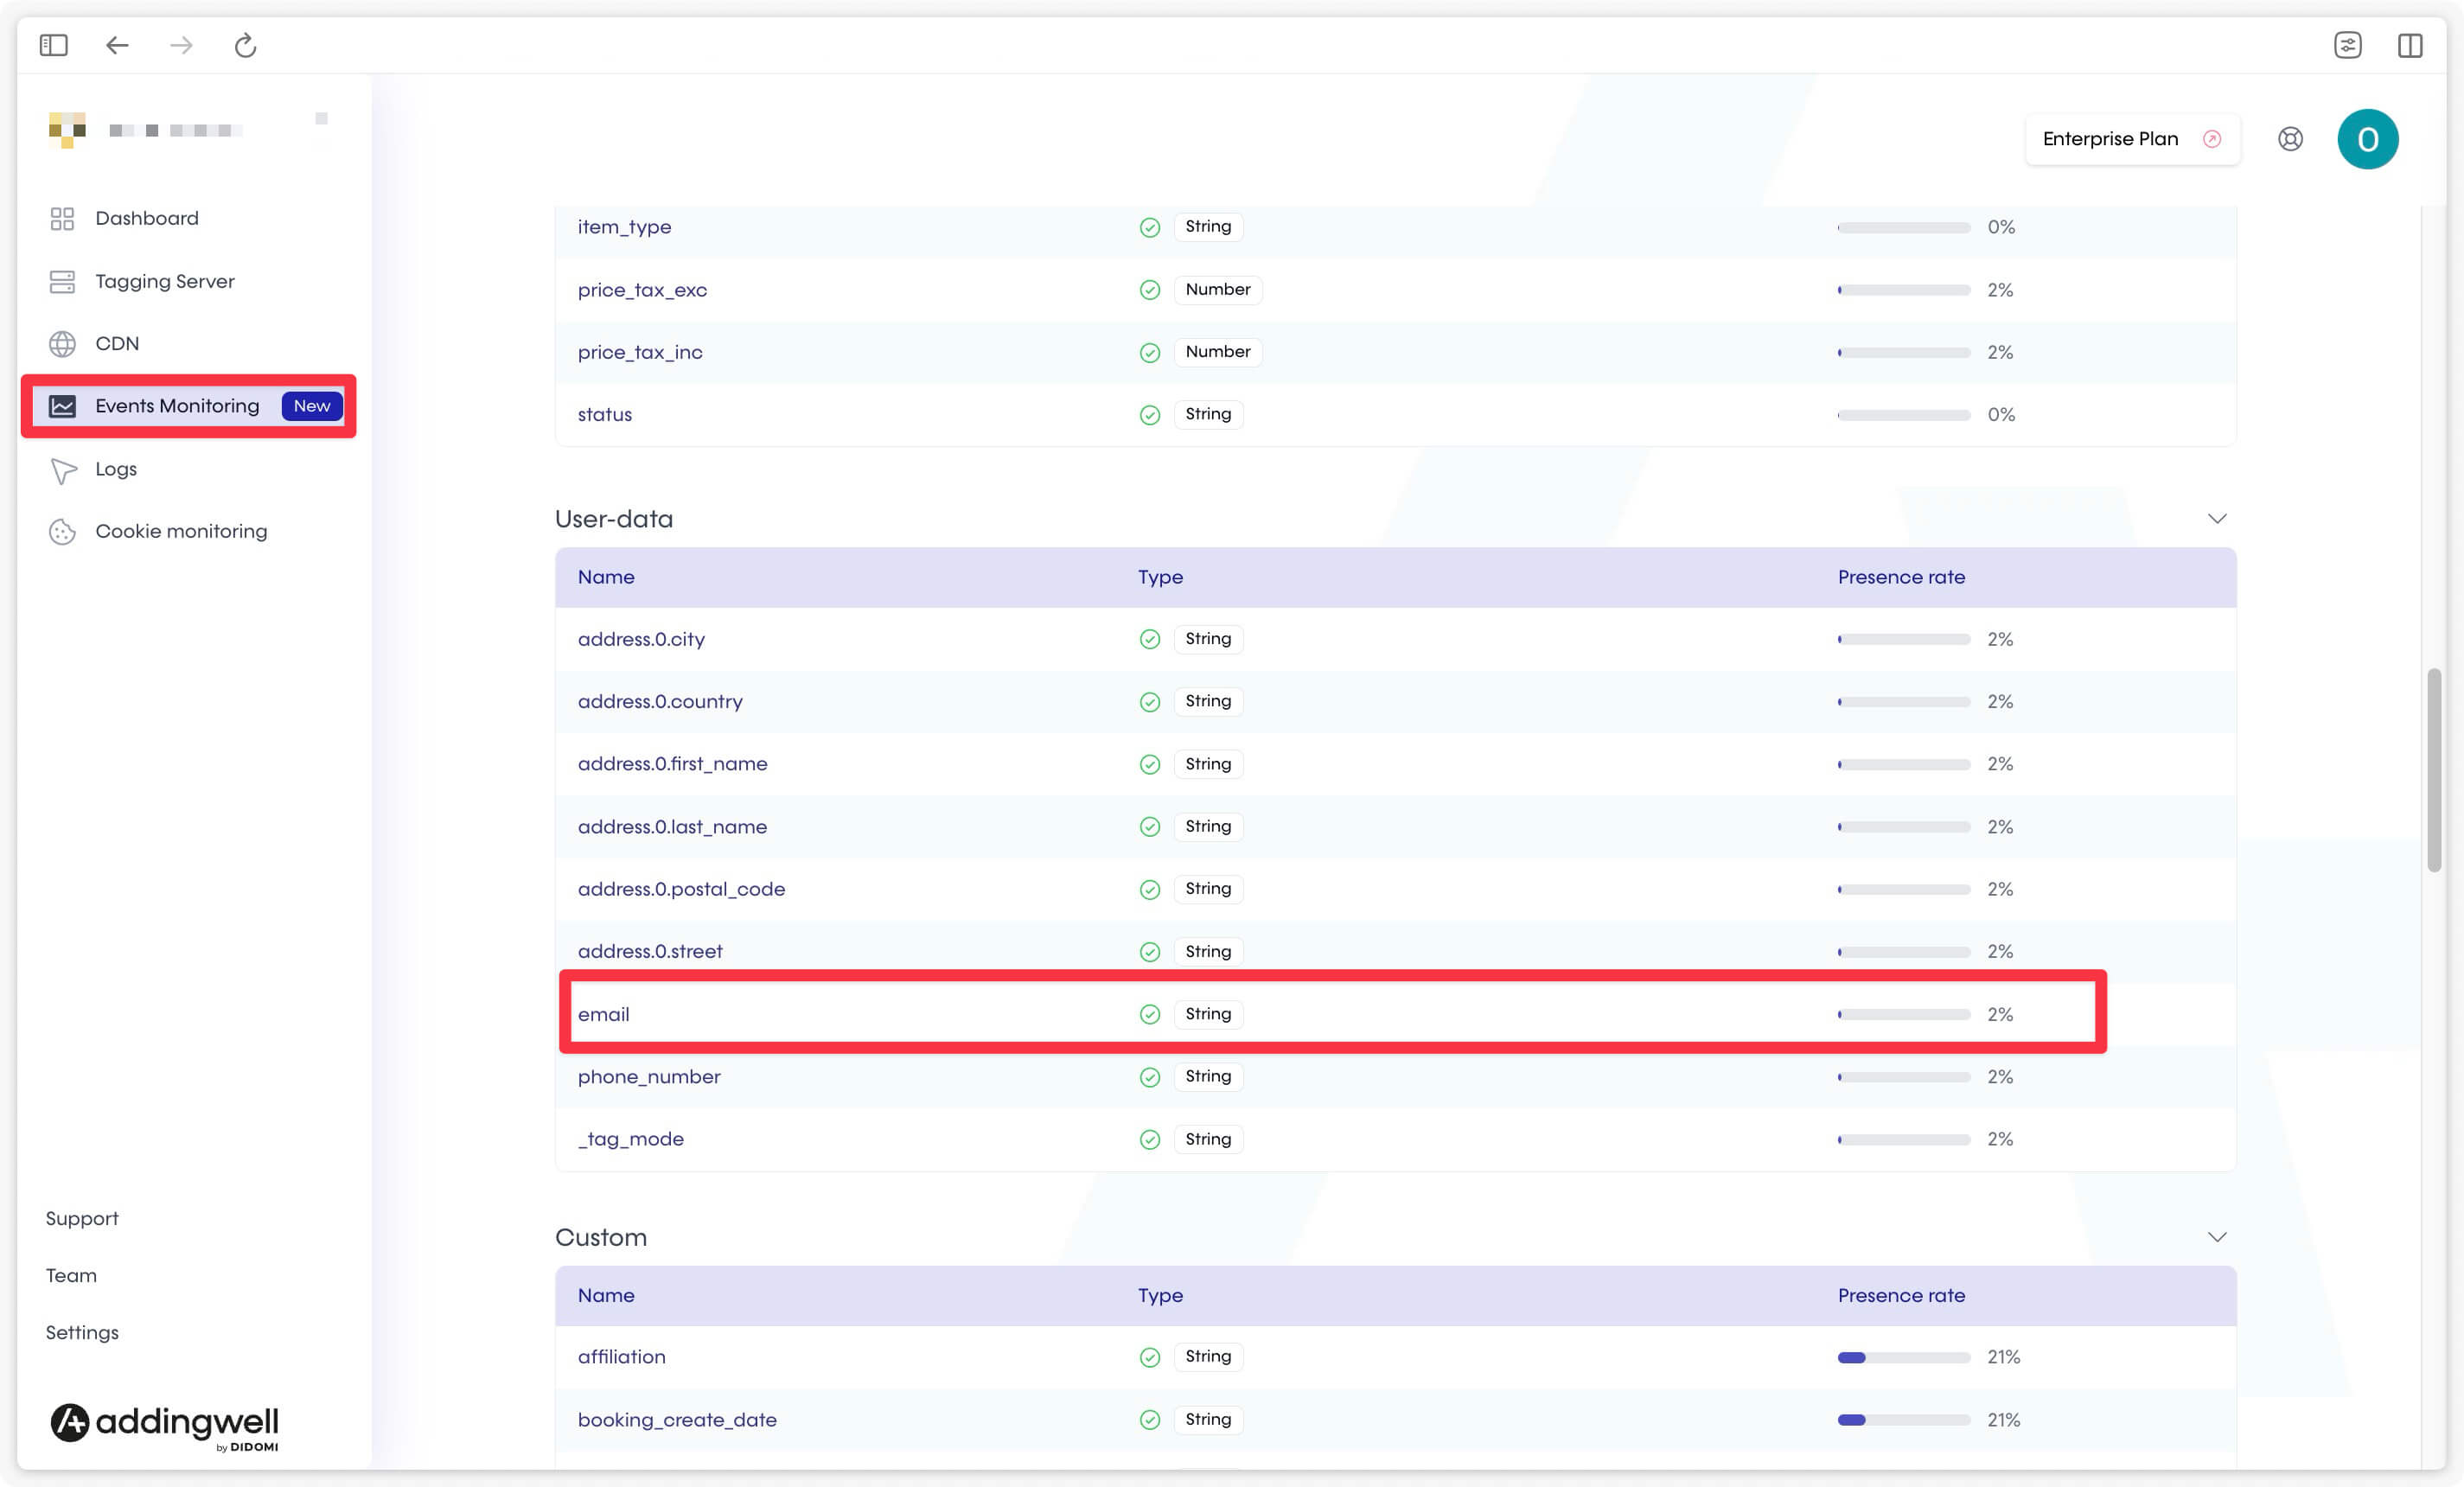
If your events do not contain user data, or if the percentages seem off, review your GTM Web setup. To learn how to send user data to your Server container, refer to our documentation on the subject.
It’s normal for some events like page_view not to include user data (since the user is generally not logged in at that point). However, events like login or purchase should logically include the user’s email 100% of the time.
Cookie Monitoring: Maintaining Cookies for More than 7 Days on Safari
With Safari’s stricter cookie restrictions, you can quickly check whether your current setup effectively bypasses Safari’s ITP limitations.
Our Cookie Monitoring tool allows you to verify that you can track Safari users when they return to your site, ensuring that you maintain cookies on Apple browsers beyond 7 days.
From the Cookie Monitoring tab, three cards allow you to compare traffic from the three environments: Apple, Chrome, and “other browsers” over the last 28 days.
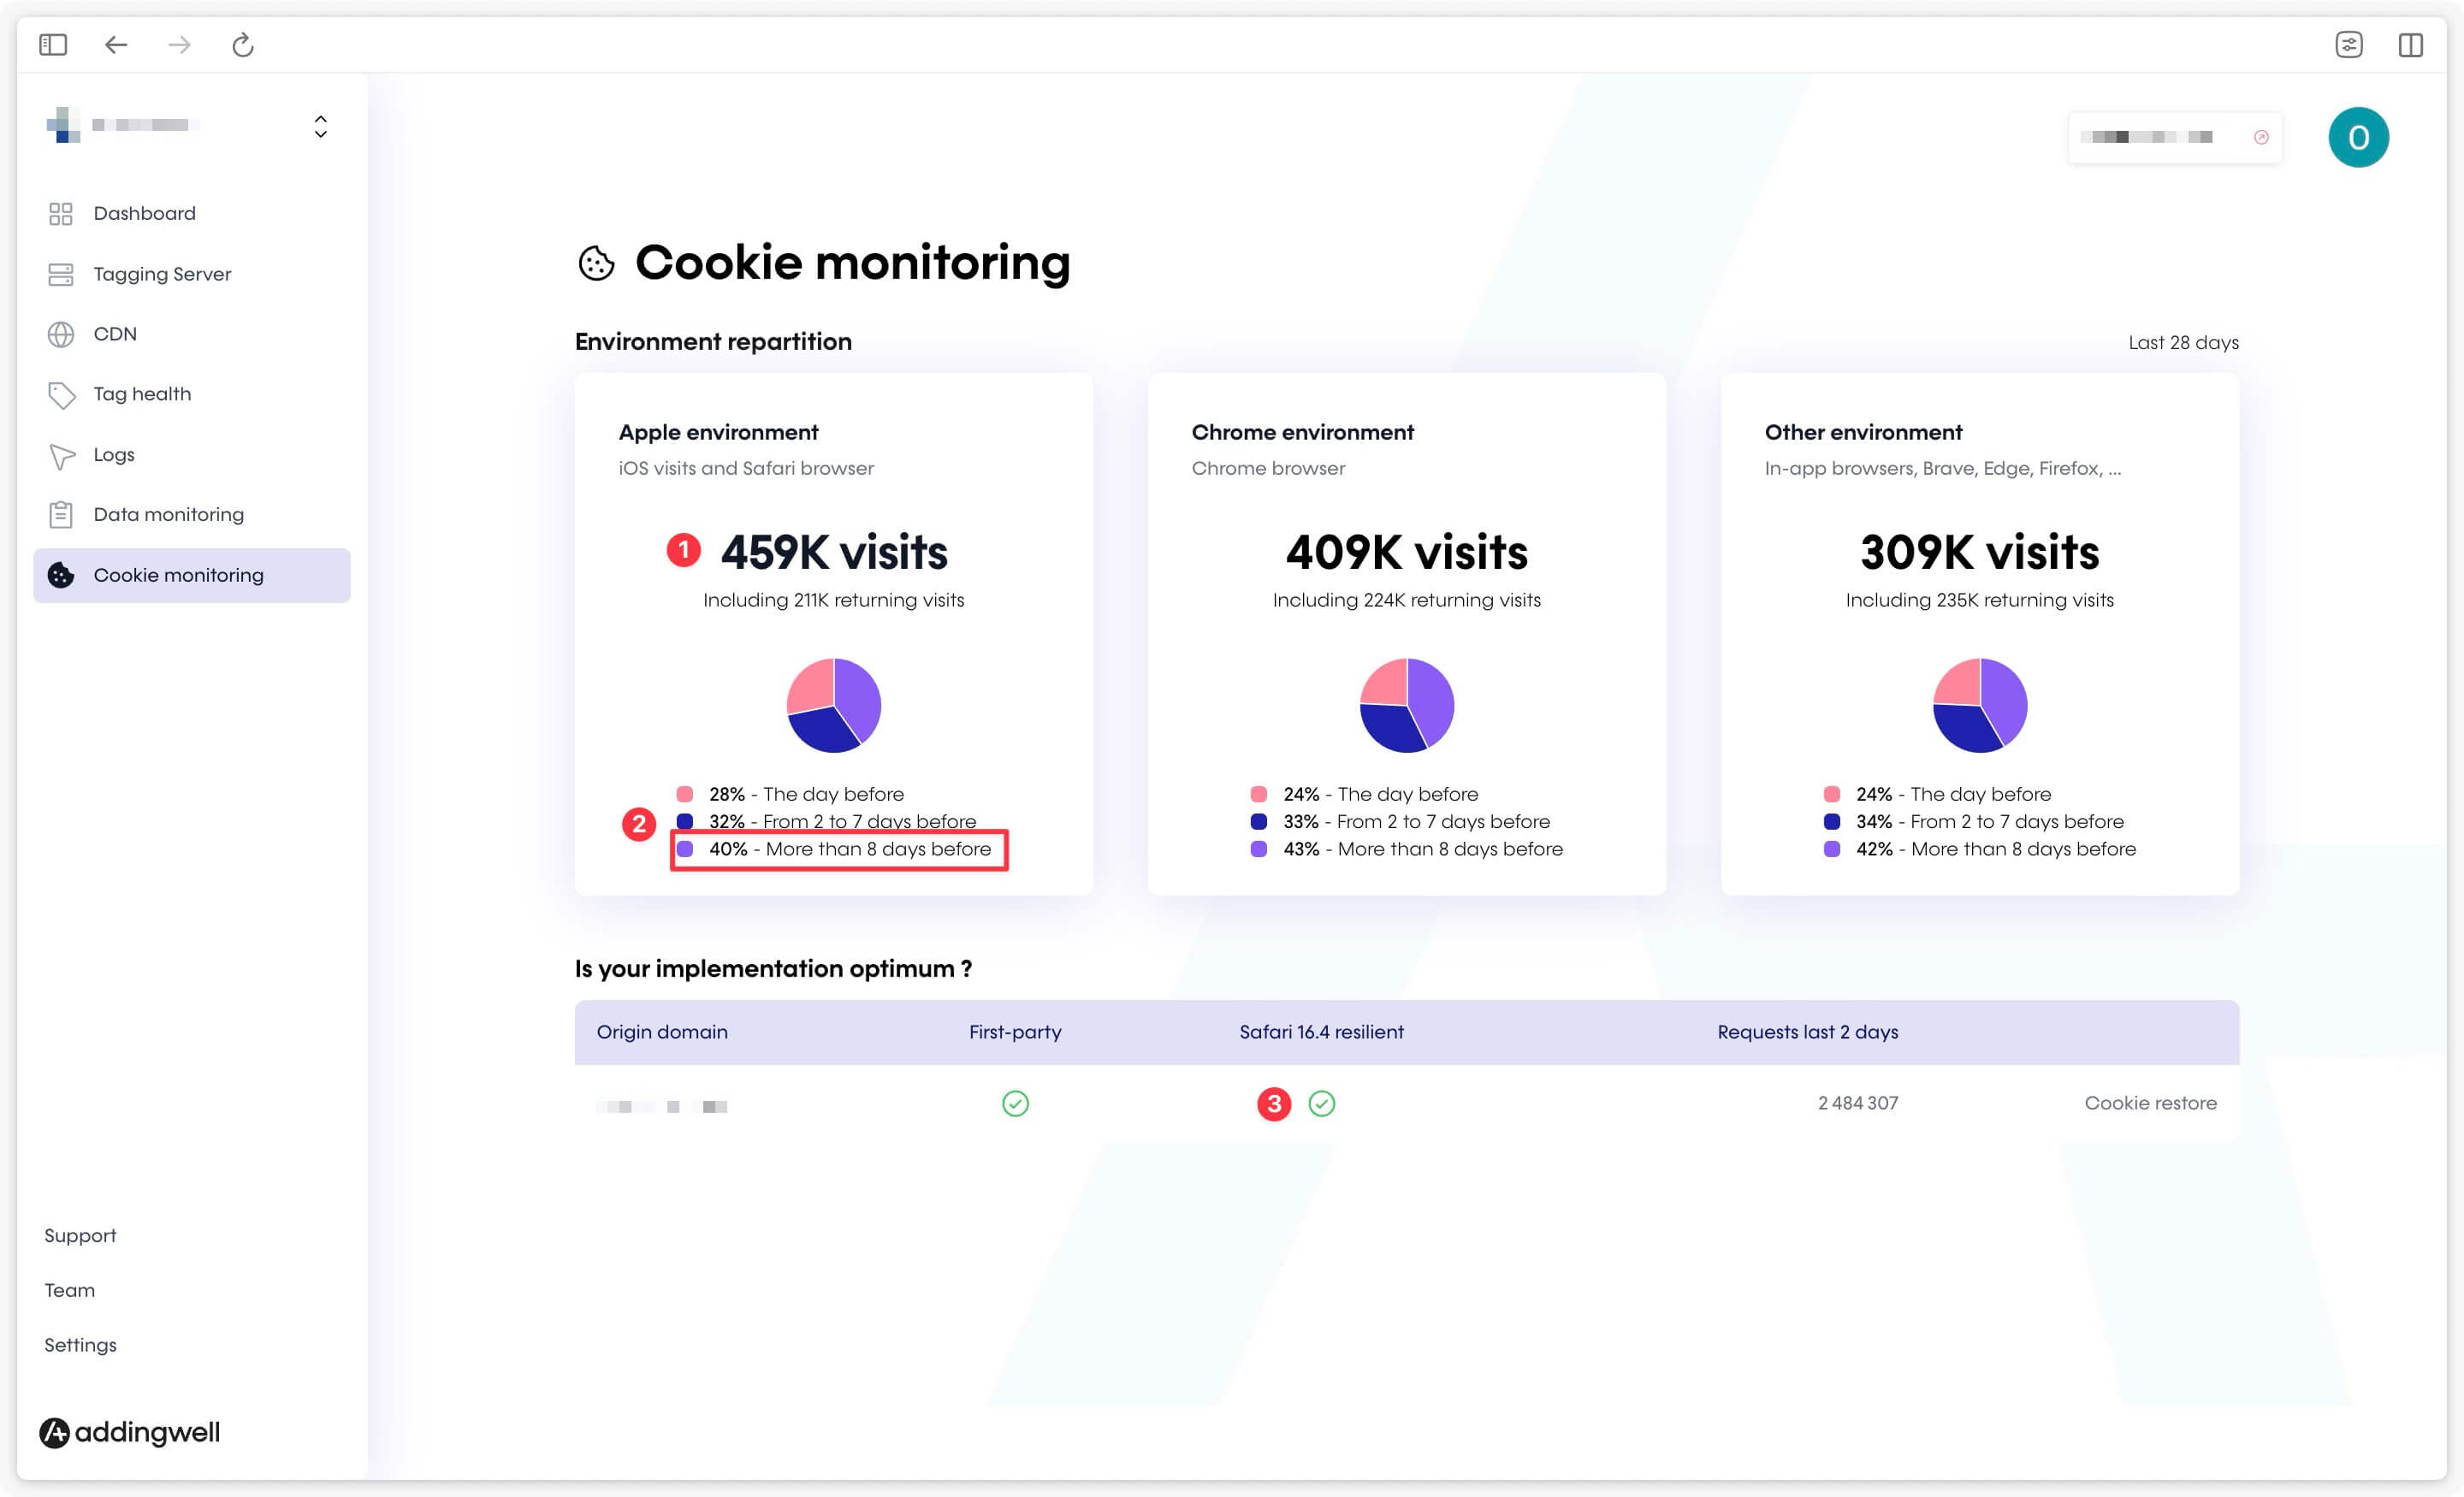
You can check:
- The number of visitors for each browser type over the last 28 days. In our example, there were 459K visitors from Safari, 211K of whom returned to the site.
- The distribution of returning visitors (211K in this example):
- 1 day after their last visit.
- Between 2 and 7 days after their last visit.
- Beyond 7 days after their last visit. This last percentage is what you need to monitor for Safari, comparing it with other environments (Chrome and other browsers). If the returning user rate beyond 7 days is roughly equivalent for Safari and other environments, your setup is functioning correctly, and your cookies are persisting properly on Safari.
- That your configuration is resilient on Safari (indicated by the green symbol) if you have implemented the Cookie Restore solution.
Warning: If you are using the Reverse Proxy solution, the indicator will not be green here. In that case, simply check that the percentage of returning users for Safari beyond 7 days is consistent (i.e., similar to other types of browsers). If this is the case, your Reverse Proxy is working correctly for maintaining cookies on Safari.
Congratulations! 🎉
Great! You now know how to make the most of your Addingwell container for effective server-side monitoring. Feel free to explore these tools to ensure the longevity and performance of your setup. If you encounter any issues, contact the Addingwell support team.