Alerting: monitor the health of your tracking
Your tracking can stop working without any visible sign on your website. An update, a consent change, or a configuration error can interrupt or degrade data collection, sometimes for several hours or even days.
Addingwell alerts allow you to move from a reactive mode to a proactive one: you are automatically notified as soon as abnormal behavior is detected, so you can act before your data is durably impacted.
Our alerts continuously monitor the health of your server-side tracking and identify anomalies that may affect the reliability of your data.
With alerts, you can:
- quickly detect tracking interruptions,
- avoid missing or incorrect data,
- limit miscounted conversions,
- make decisions based on reliable data.
Each alert is prioritized to help you understand when to act immediately and when to investigate later.
Manage and understand alerts
Addingwell alerts rely on automated checks executed at different frequencies (real-time, hourly, or daily), depending on the type of anomaly detected. This makes it possible to strike the right balance between responsiveness and reliability, while limiting false positives.
View alerts
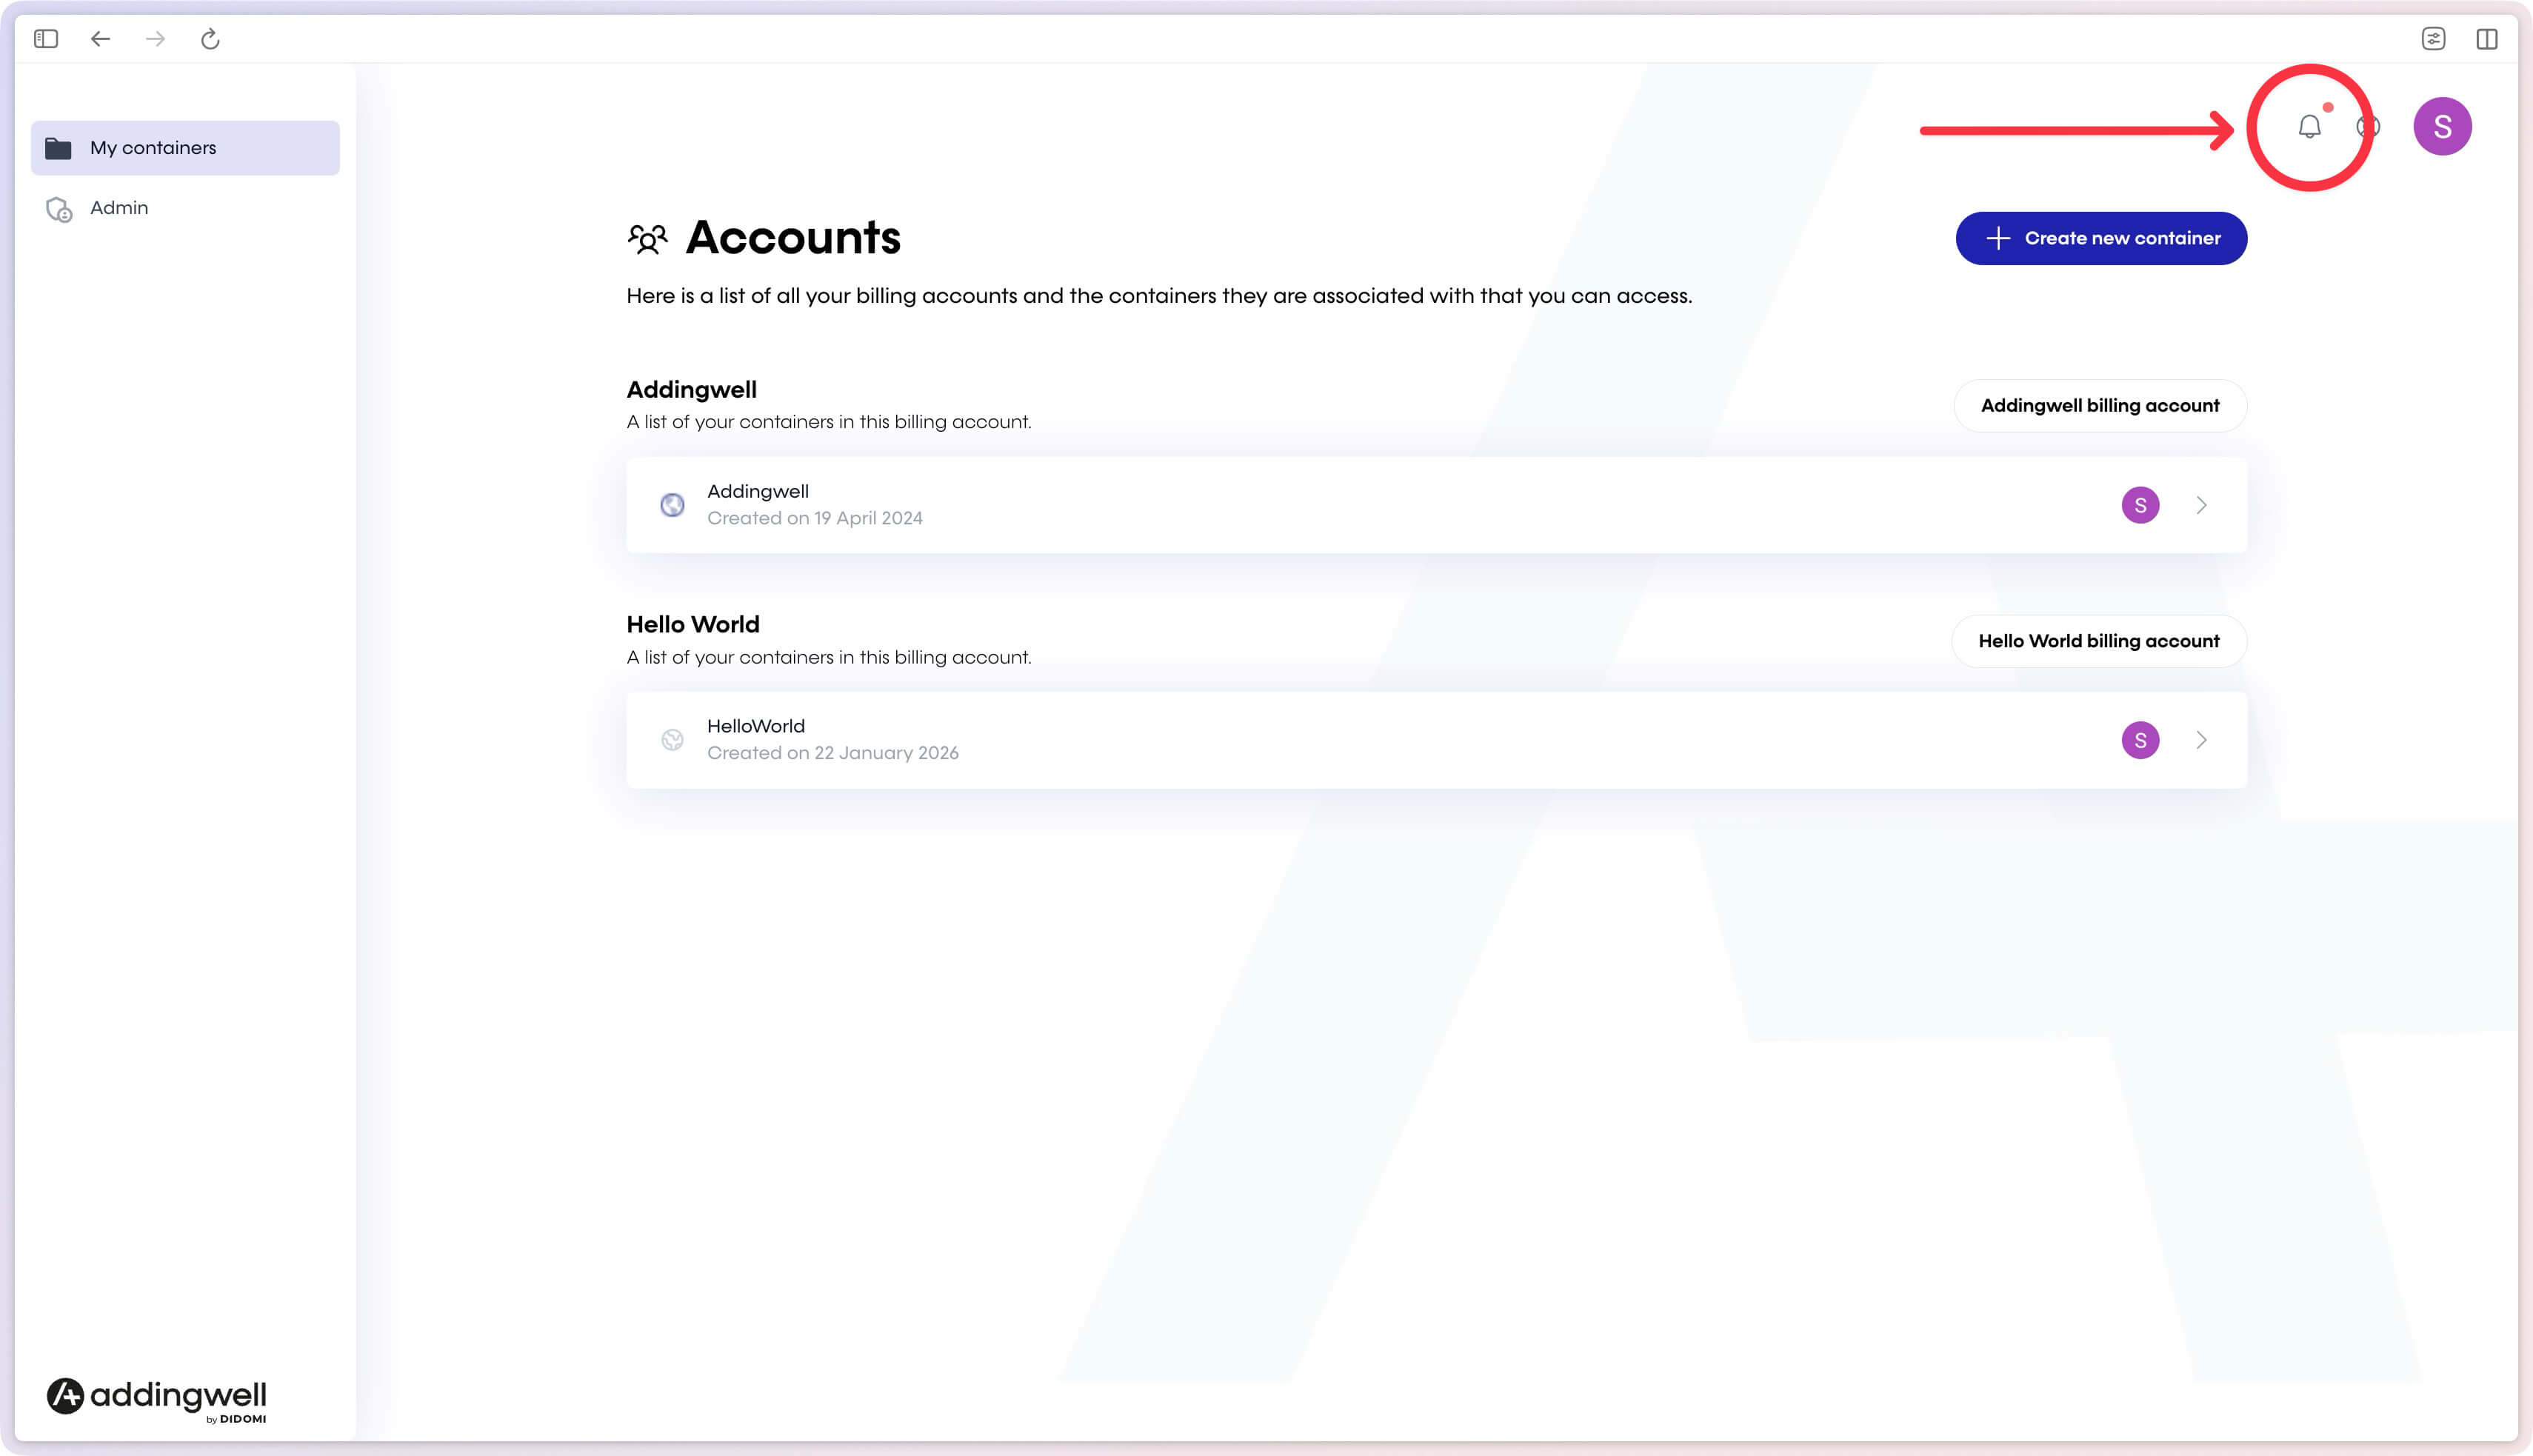
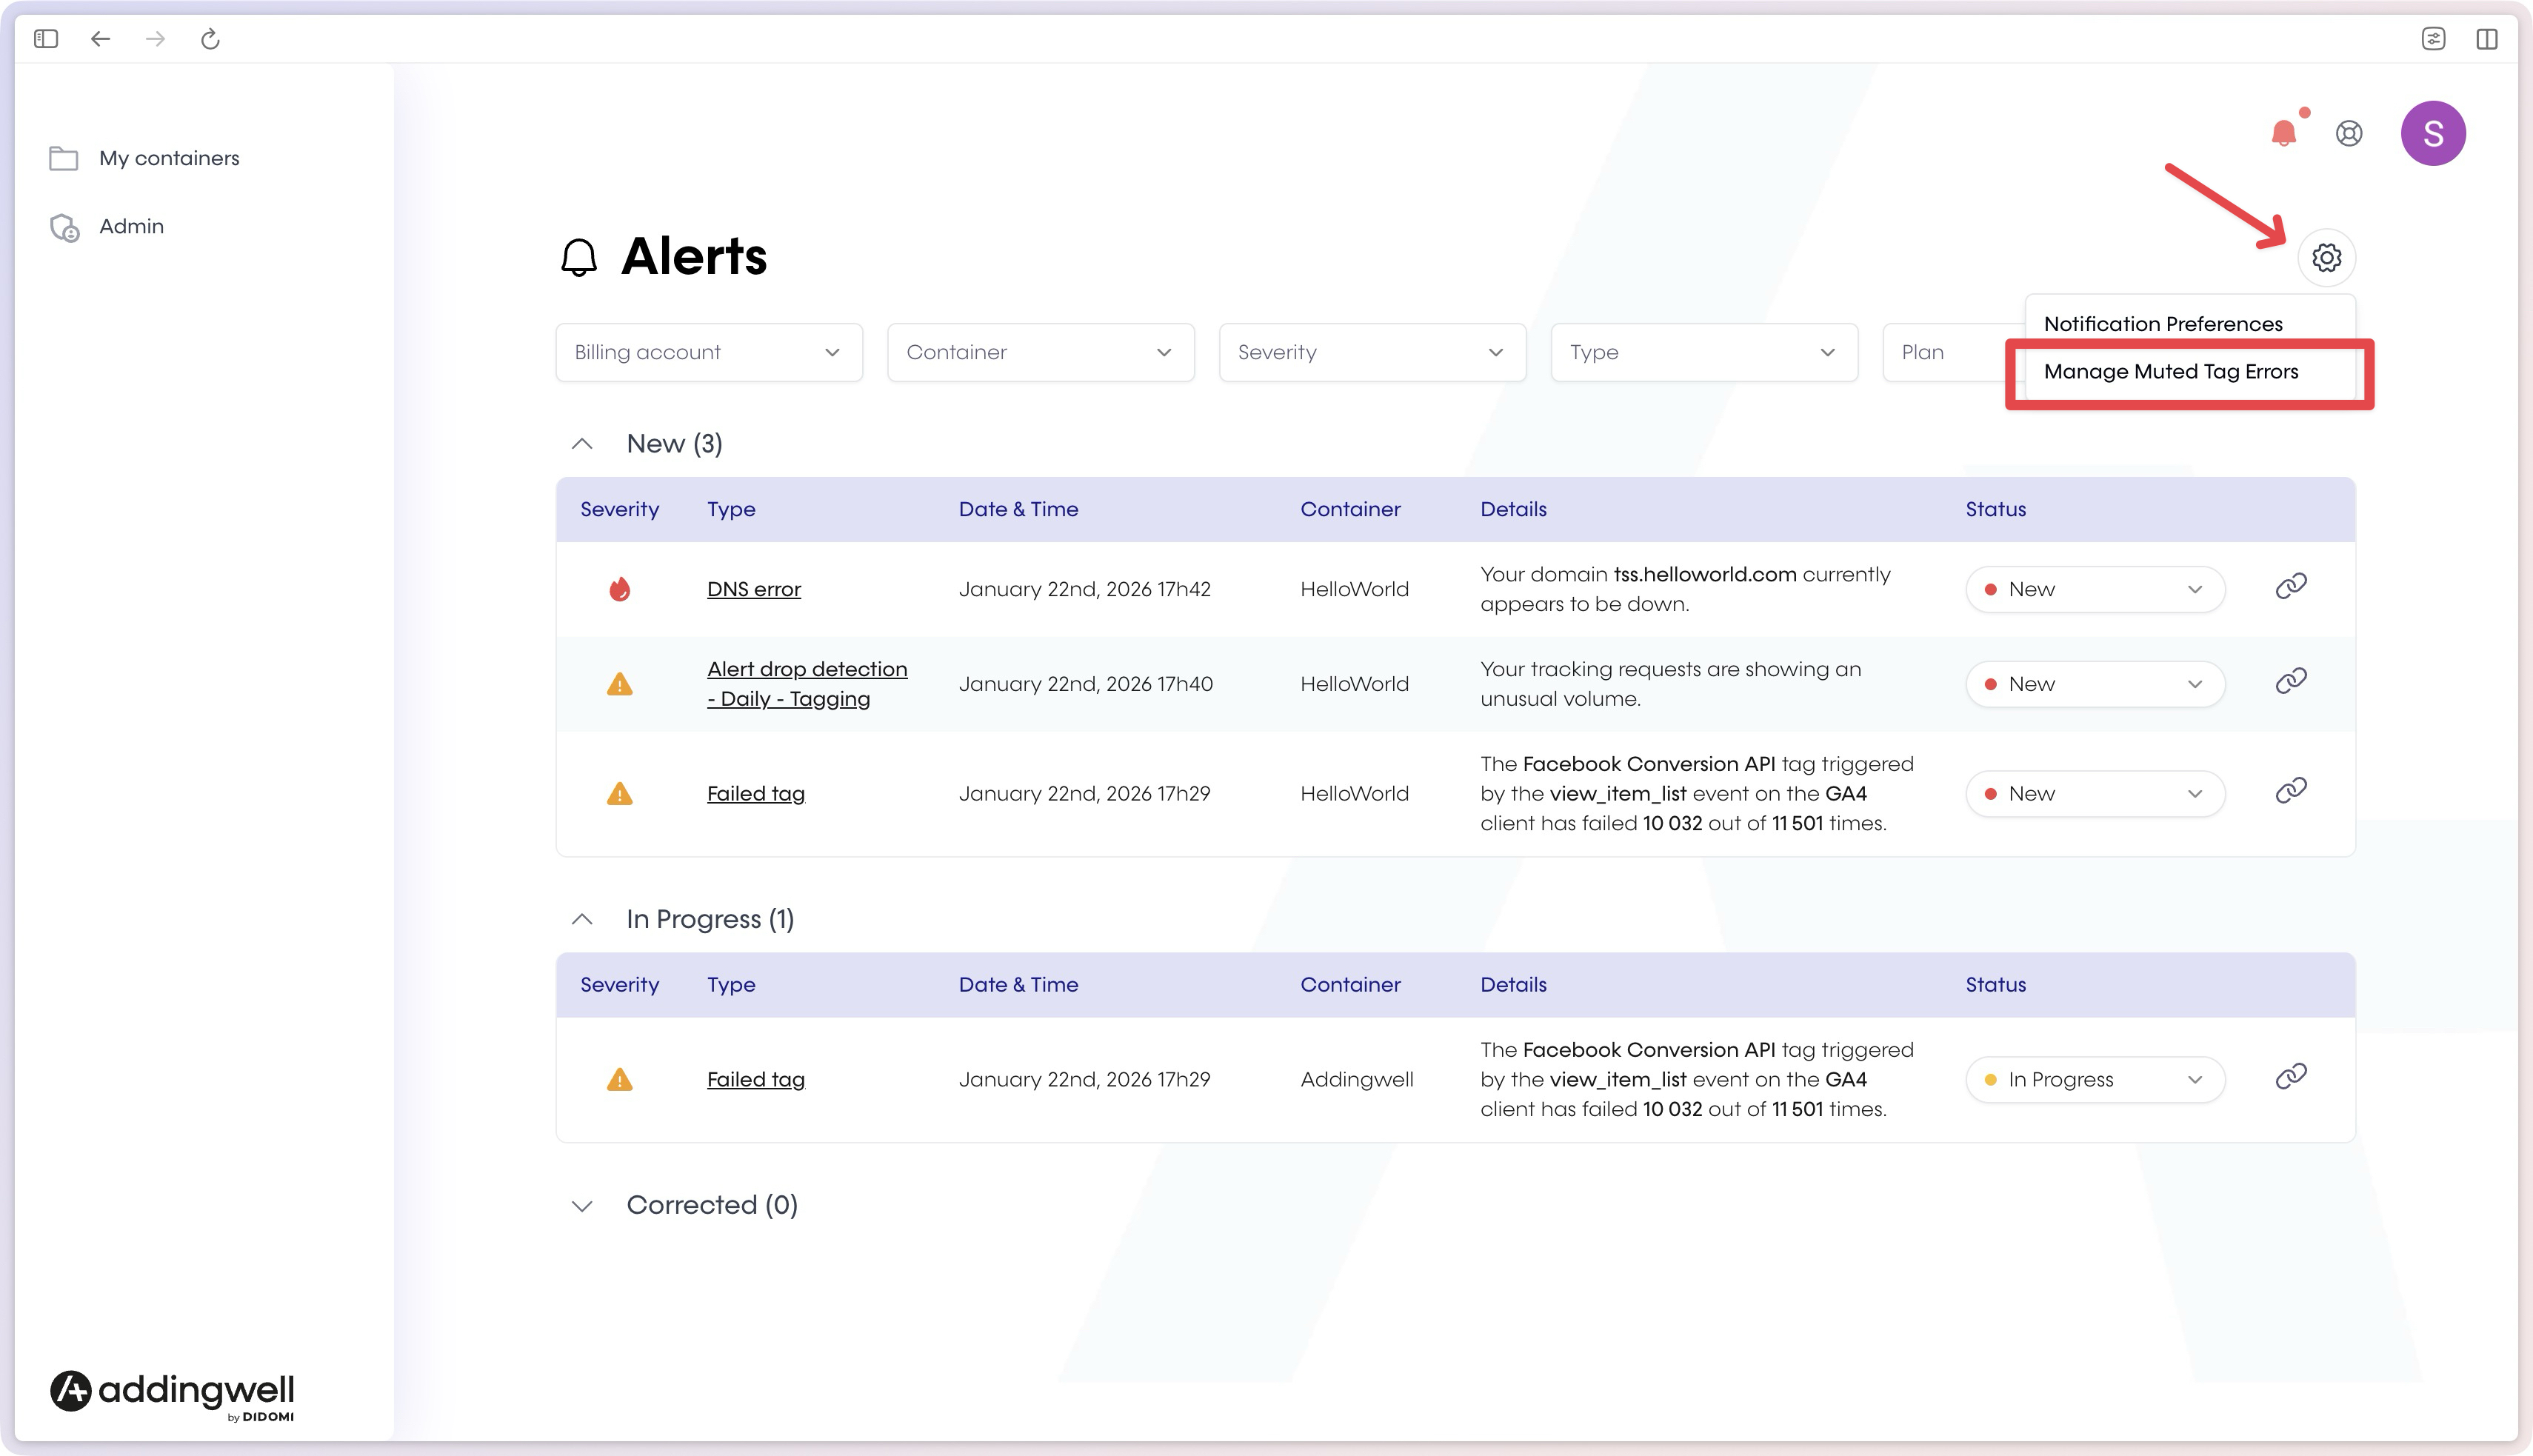
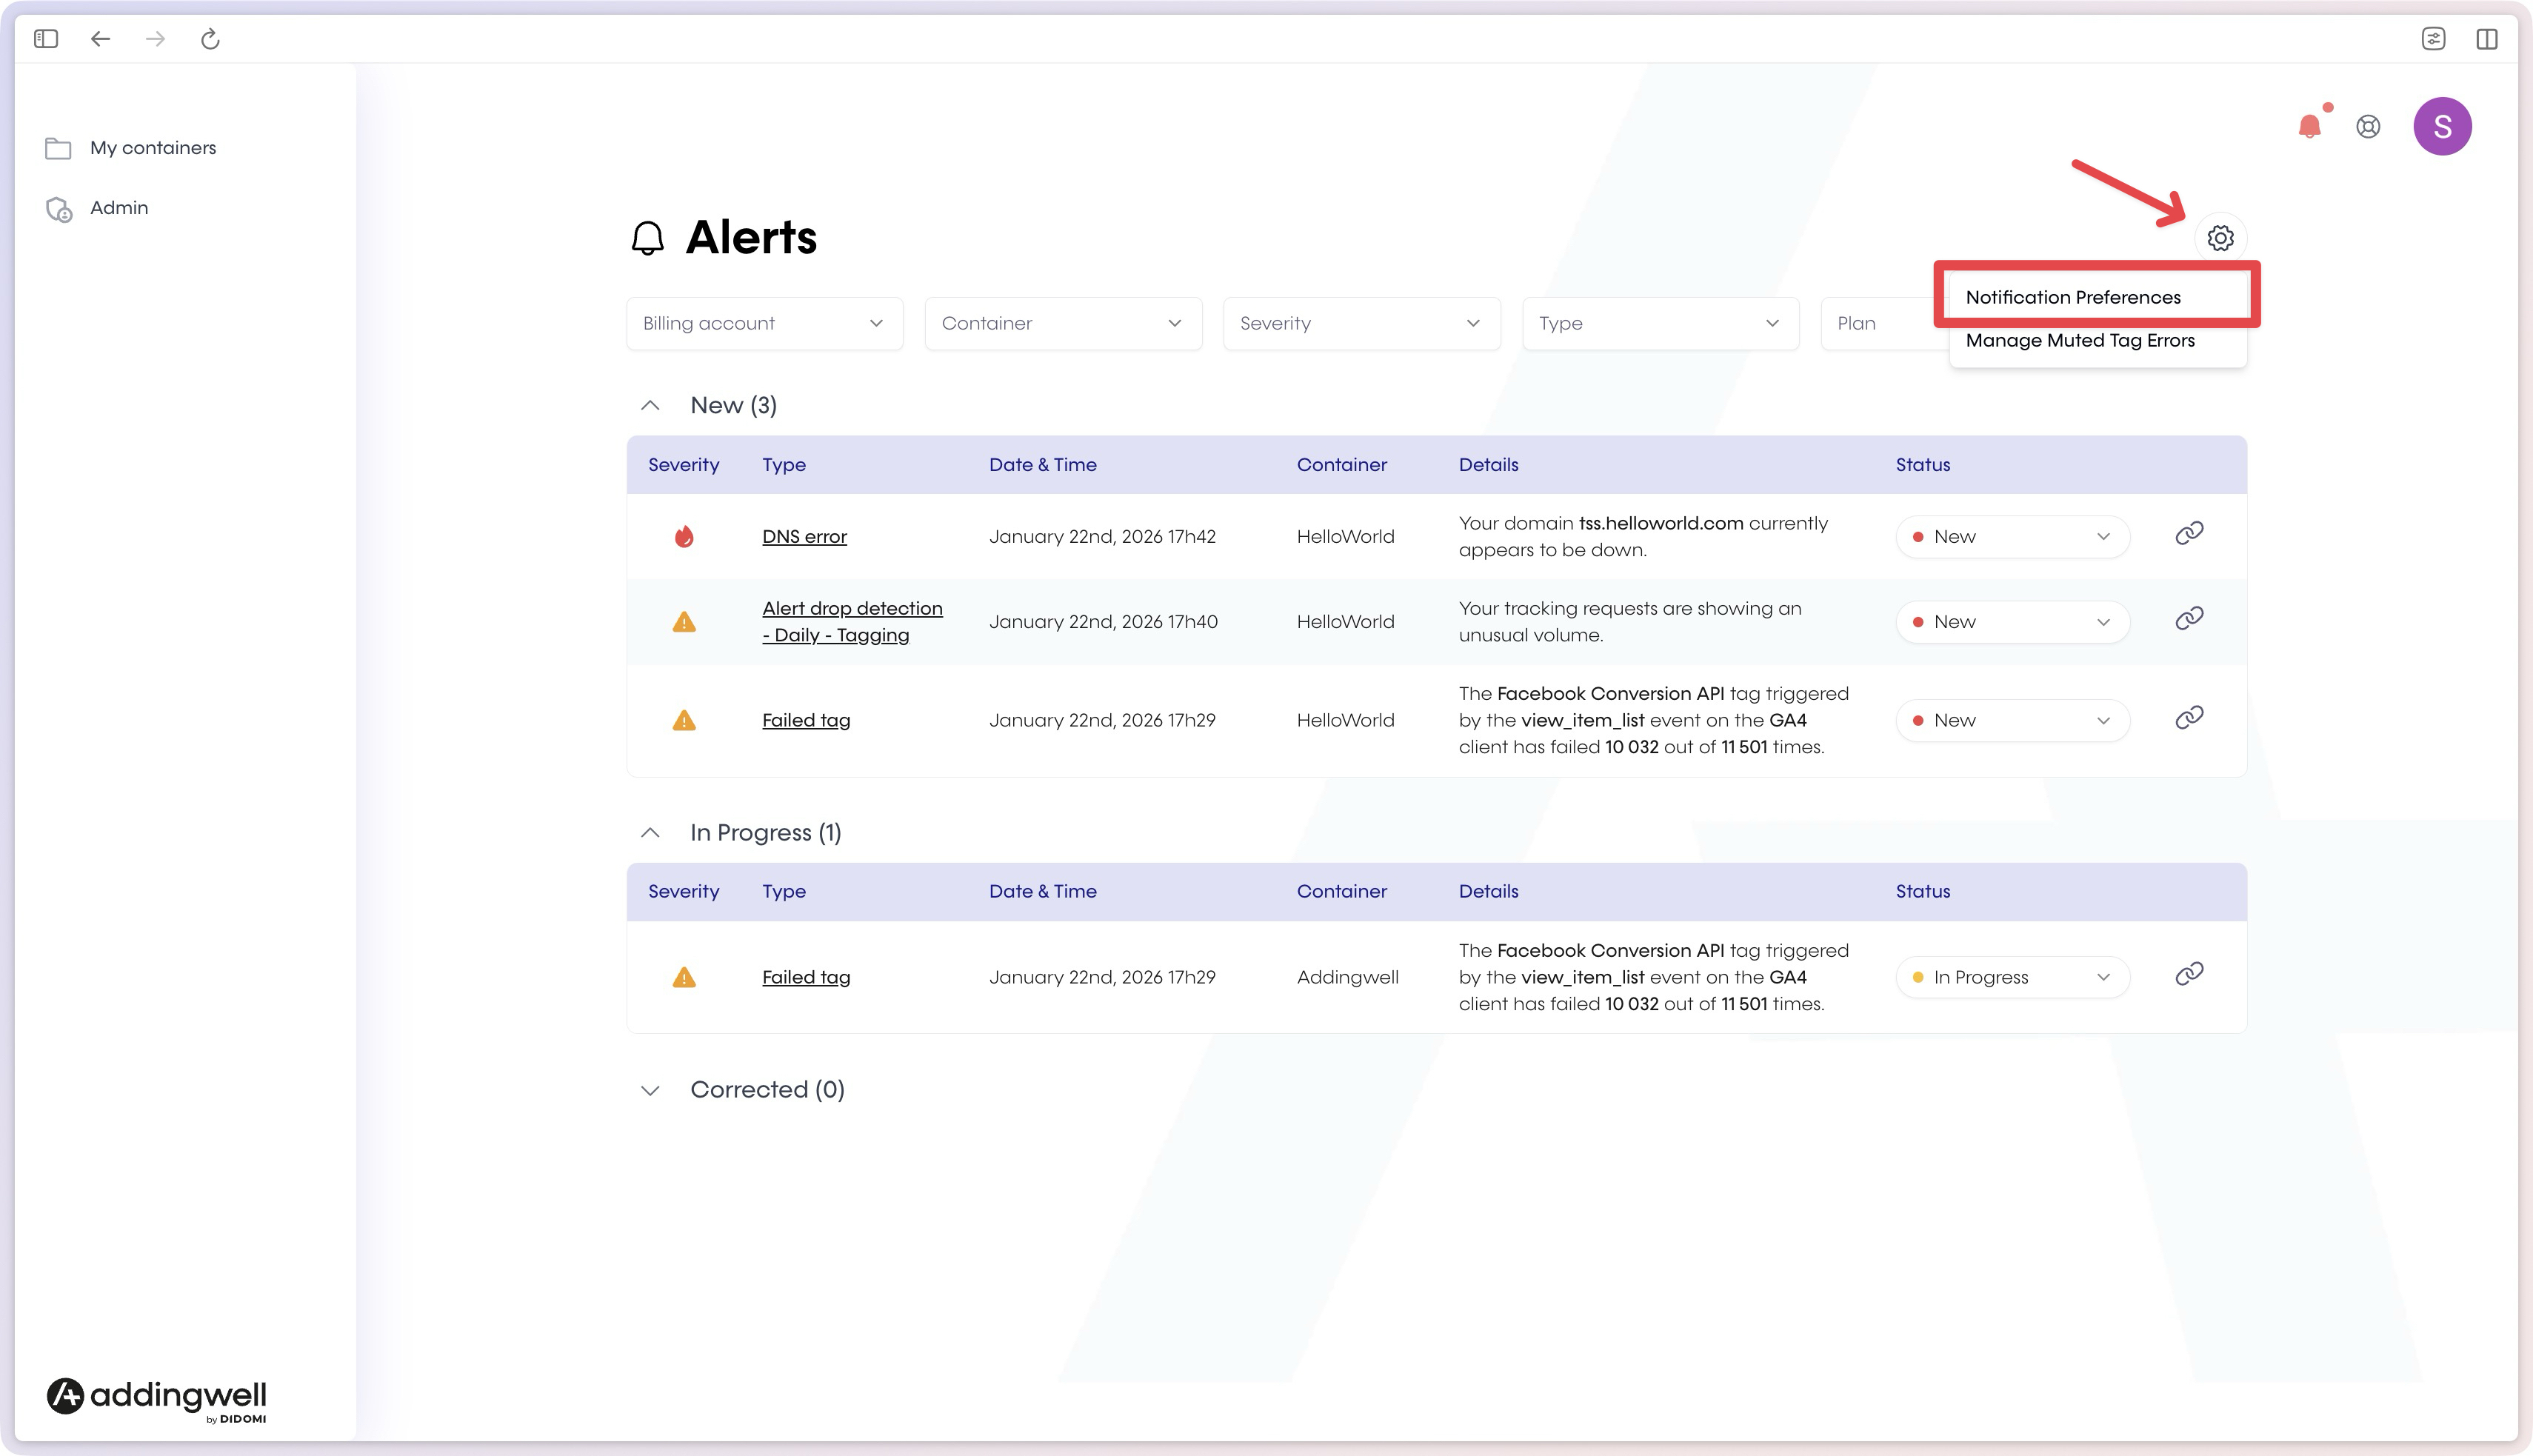
You can access the Alerts page by clicking on the notification bell icon, as shown on the screen below:
The Alerts page centralizes all alerts detected on your containers. Each row corresponds to an anomaly identified by Addingwell.
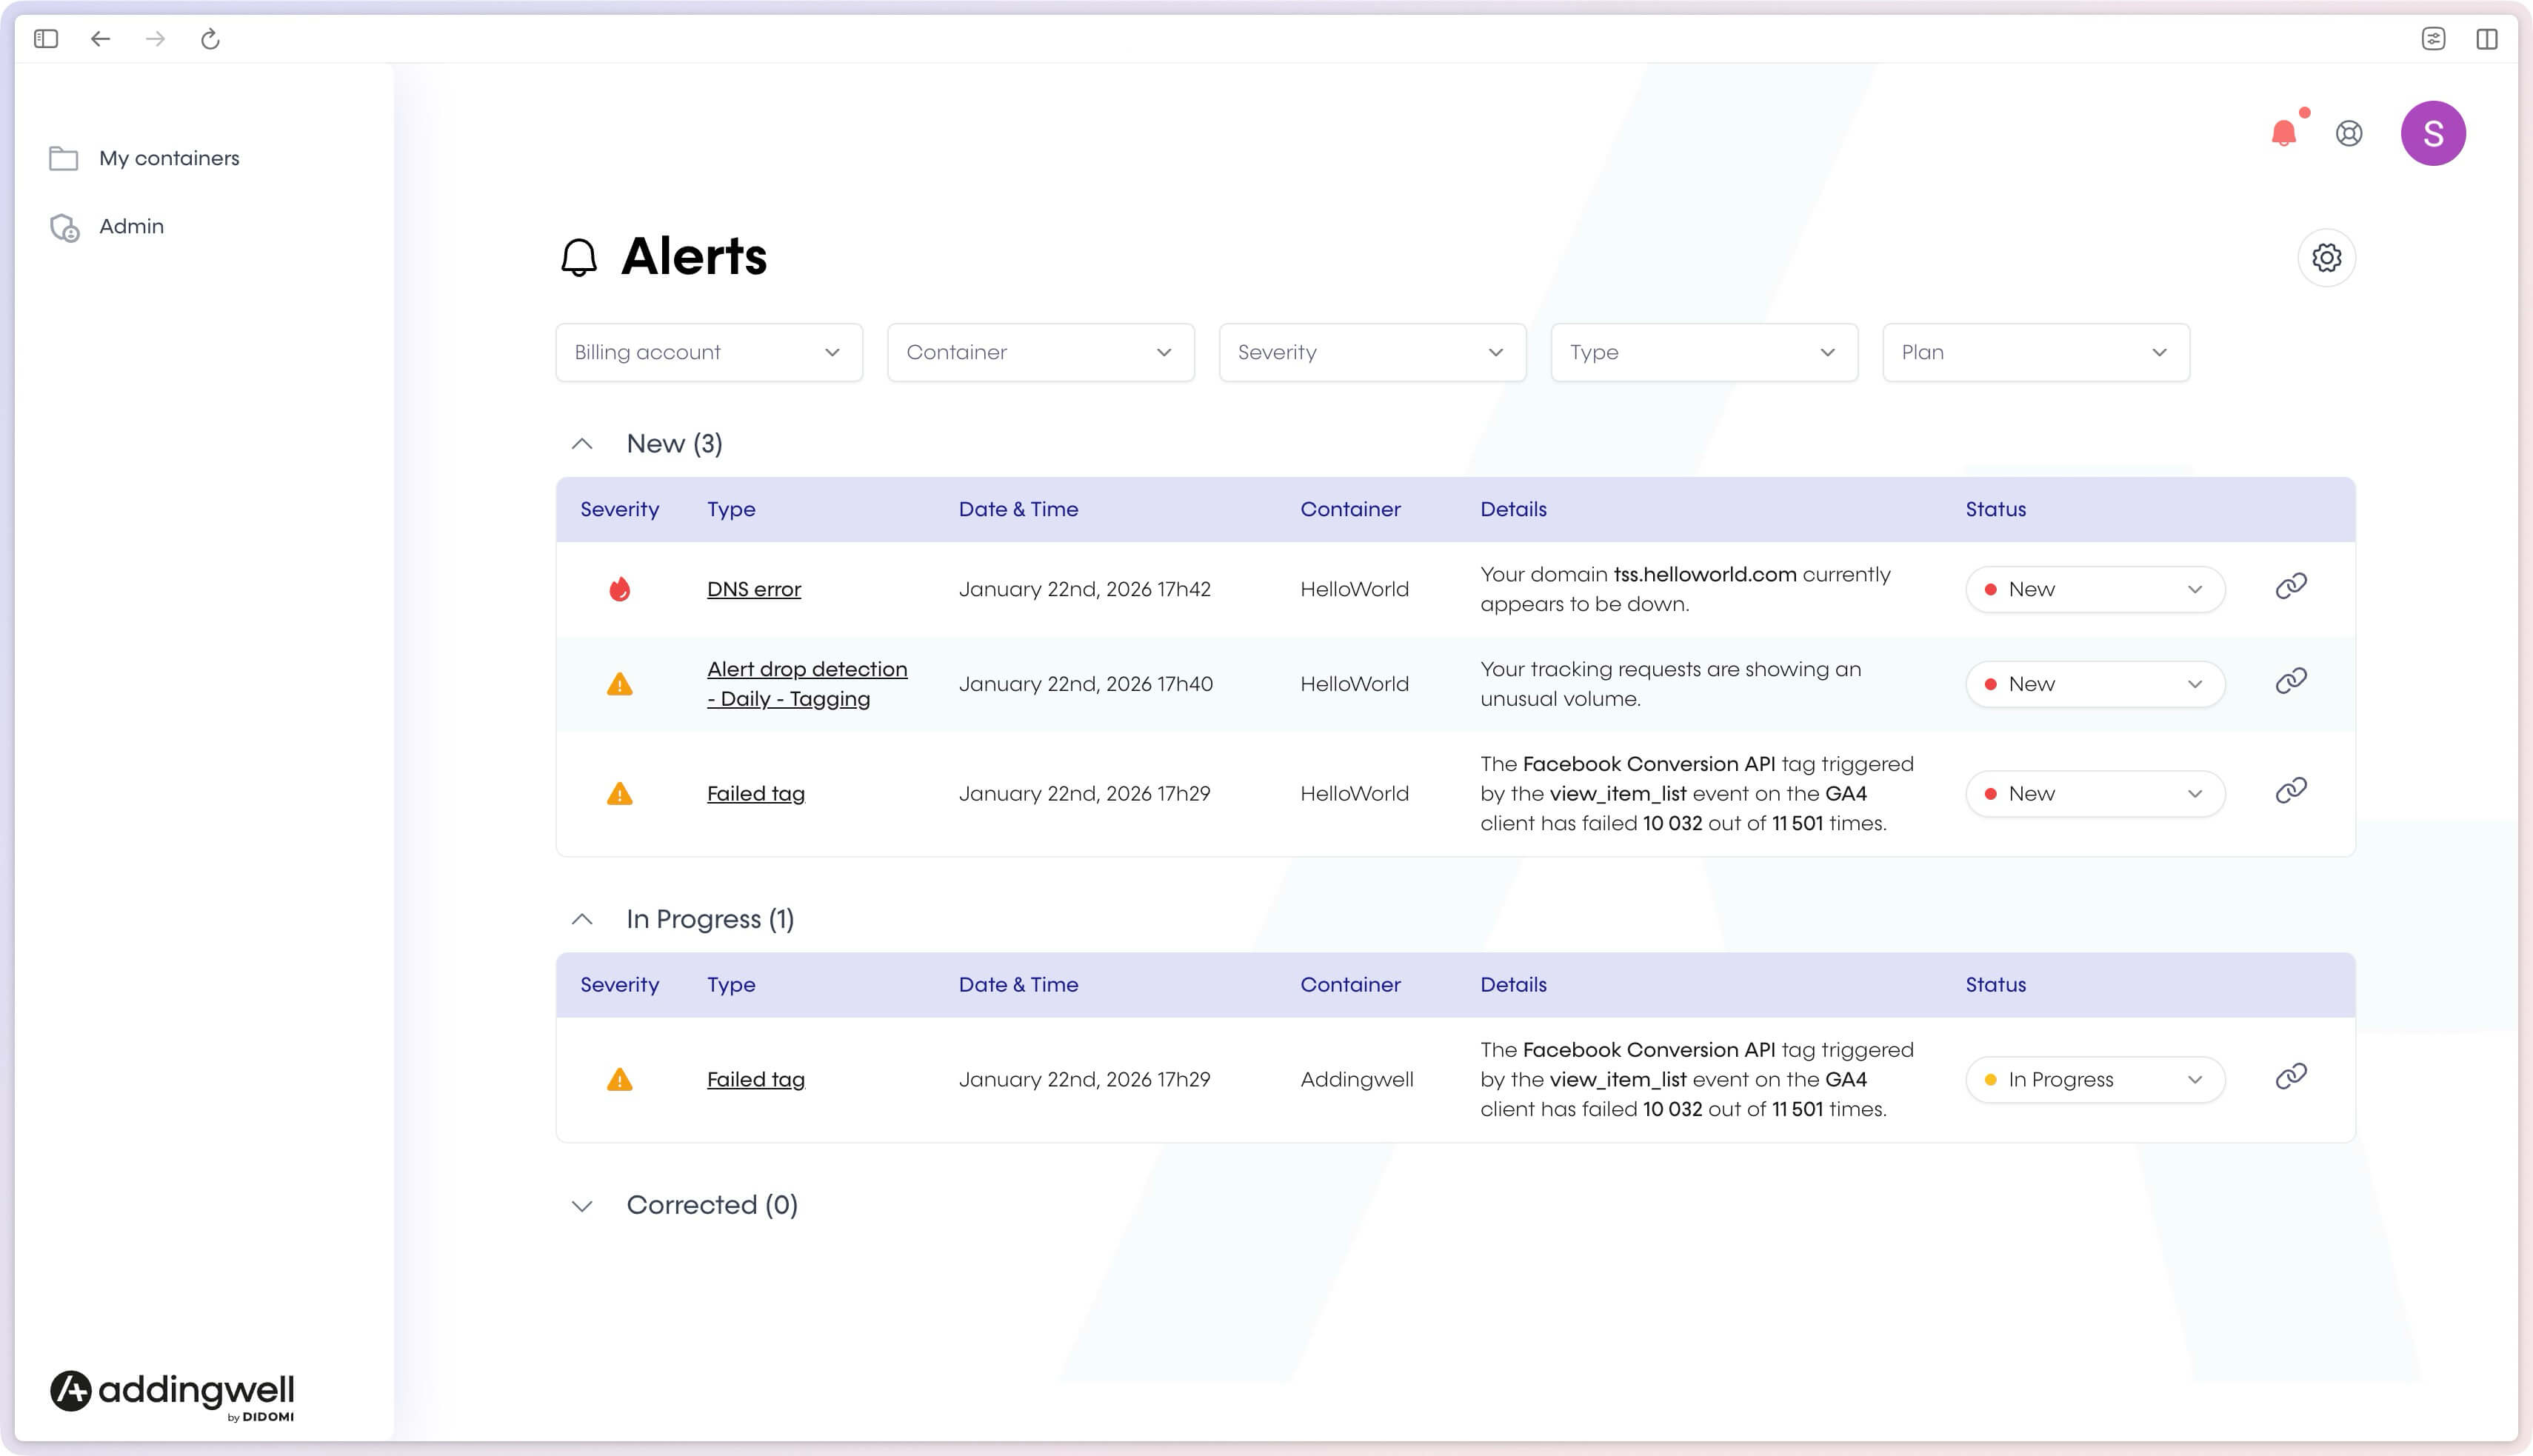
For each alert, you will find:
- the priority level,
- the alert type,
- the detection date and time,
- the affected container,
- a summary of the issue,
- the alert status.
Filters are available at the top of the page to help you focus on what matters most:
- Billing account
- Container
- Severity
- Type
- Plan
Types of detected alerts
Addingwell continuously analyzes your data flows and triggers alerts when anomalies are detected.
| Priority | Alert type | Description |
|---|---|---|
| 🚨 Critical | DNS error | The tracking domain no longer points to Addingwell (near real-time check) |
| 🚨 Critical | Invalid config token | The server-side container is no longer linked to your account |
| ⚠️ Warning | Alert drop detection | Unusual drop in data volume (daily analysis) |
| ⚠️ Warning | Hole detection | Near-total data interruption (hourly detection) |
| ⚠️ Warning | Duplicated events | Events are being sent multiple times (daily analysis) |
| ⚠️ Warning | Failed tag | A destination tool (GA4, Meta, etc.) no longer receives data correctly |
Understand alert statuses
Each alert has a status indicating its state:
- New: the alert has just been detected
- In progress: an analysis or fix is underway
- Corrected: the issue has been resolved
- Not relevant: no action is required in your context
The status can be modified directly:
- from the alert list,
- or from the alert detail page.
View alert details
By clicking on an alert, you access a detail page that clearly explains:
- what was detected,
- why it impacts your tracking,
- what actions to take to fix the issue.
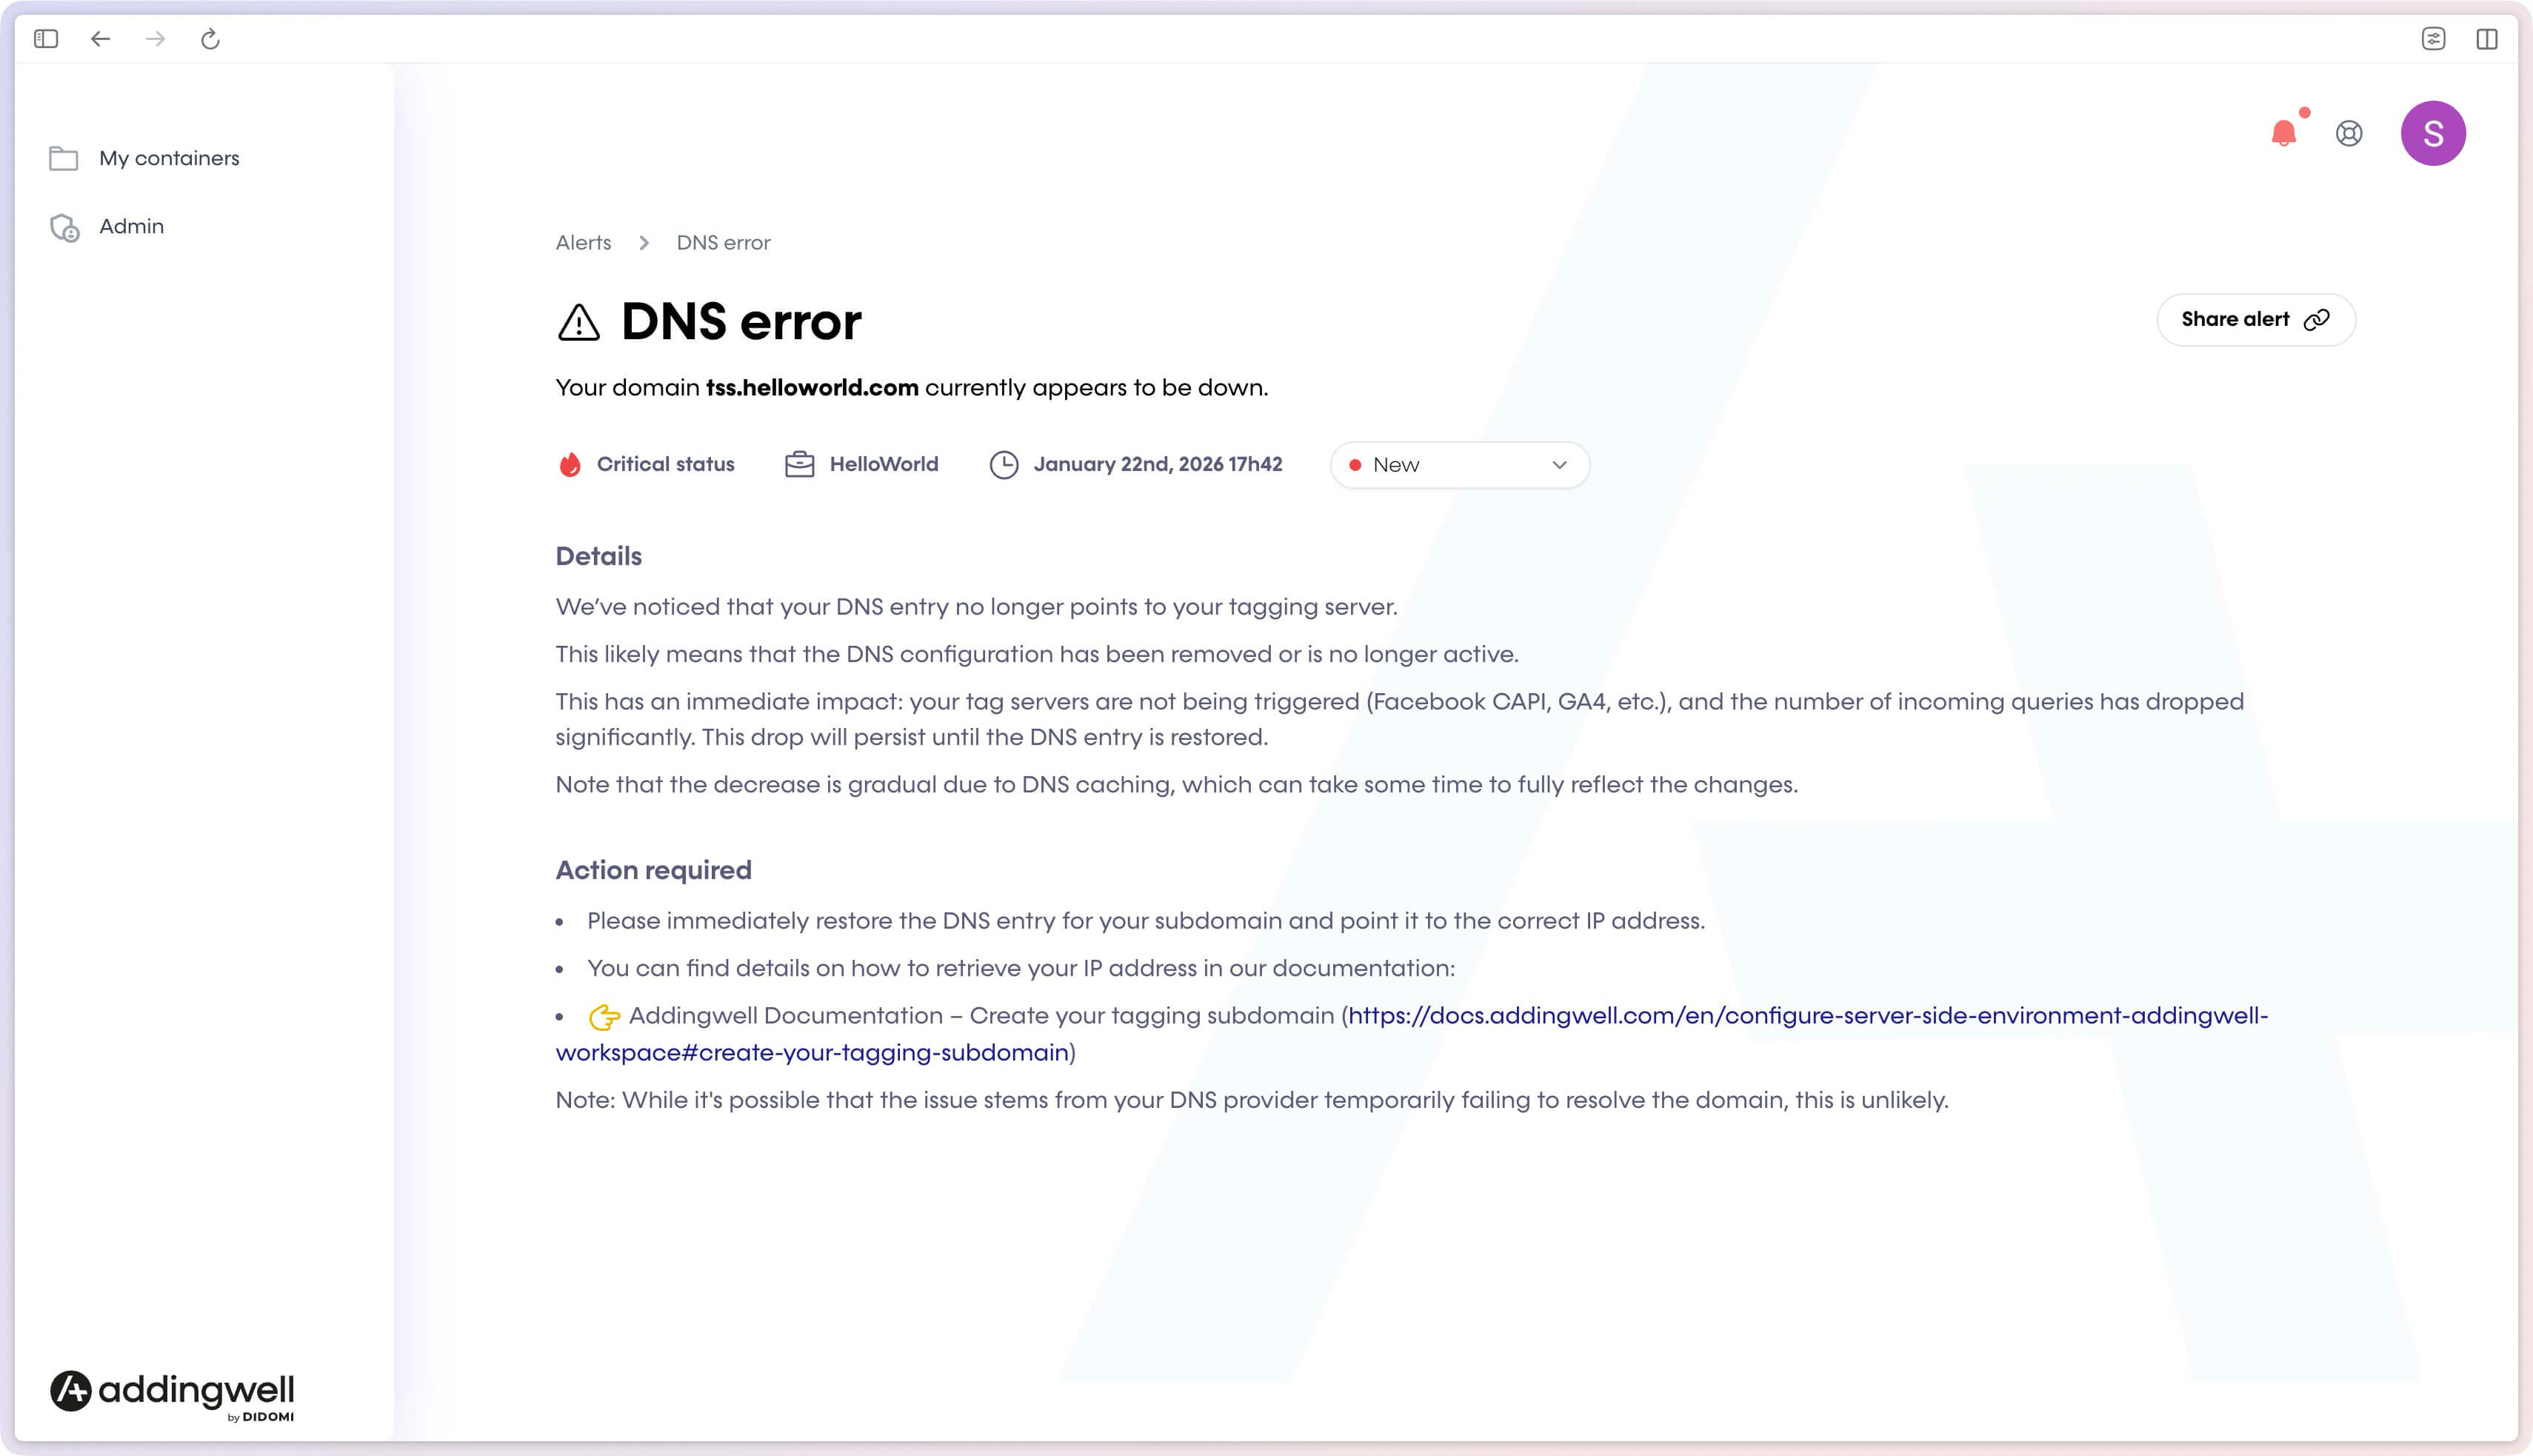
Alert example: DNS error
This alert indicates that the tracking DNS no longer points to Addingwell servers. This error has a direct impact on your tracking because no events are sent to the server-side anymore.
The Details section guides you step by step to identify the cause (the DNS was removed or is no longer active).
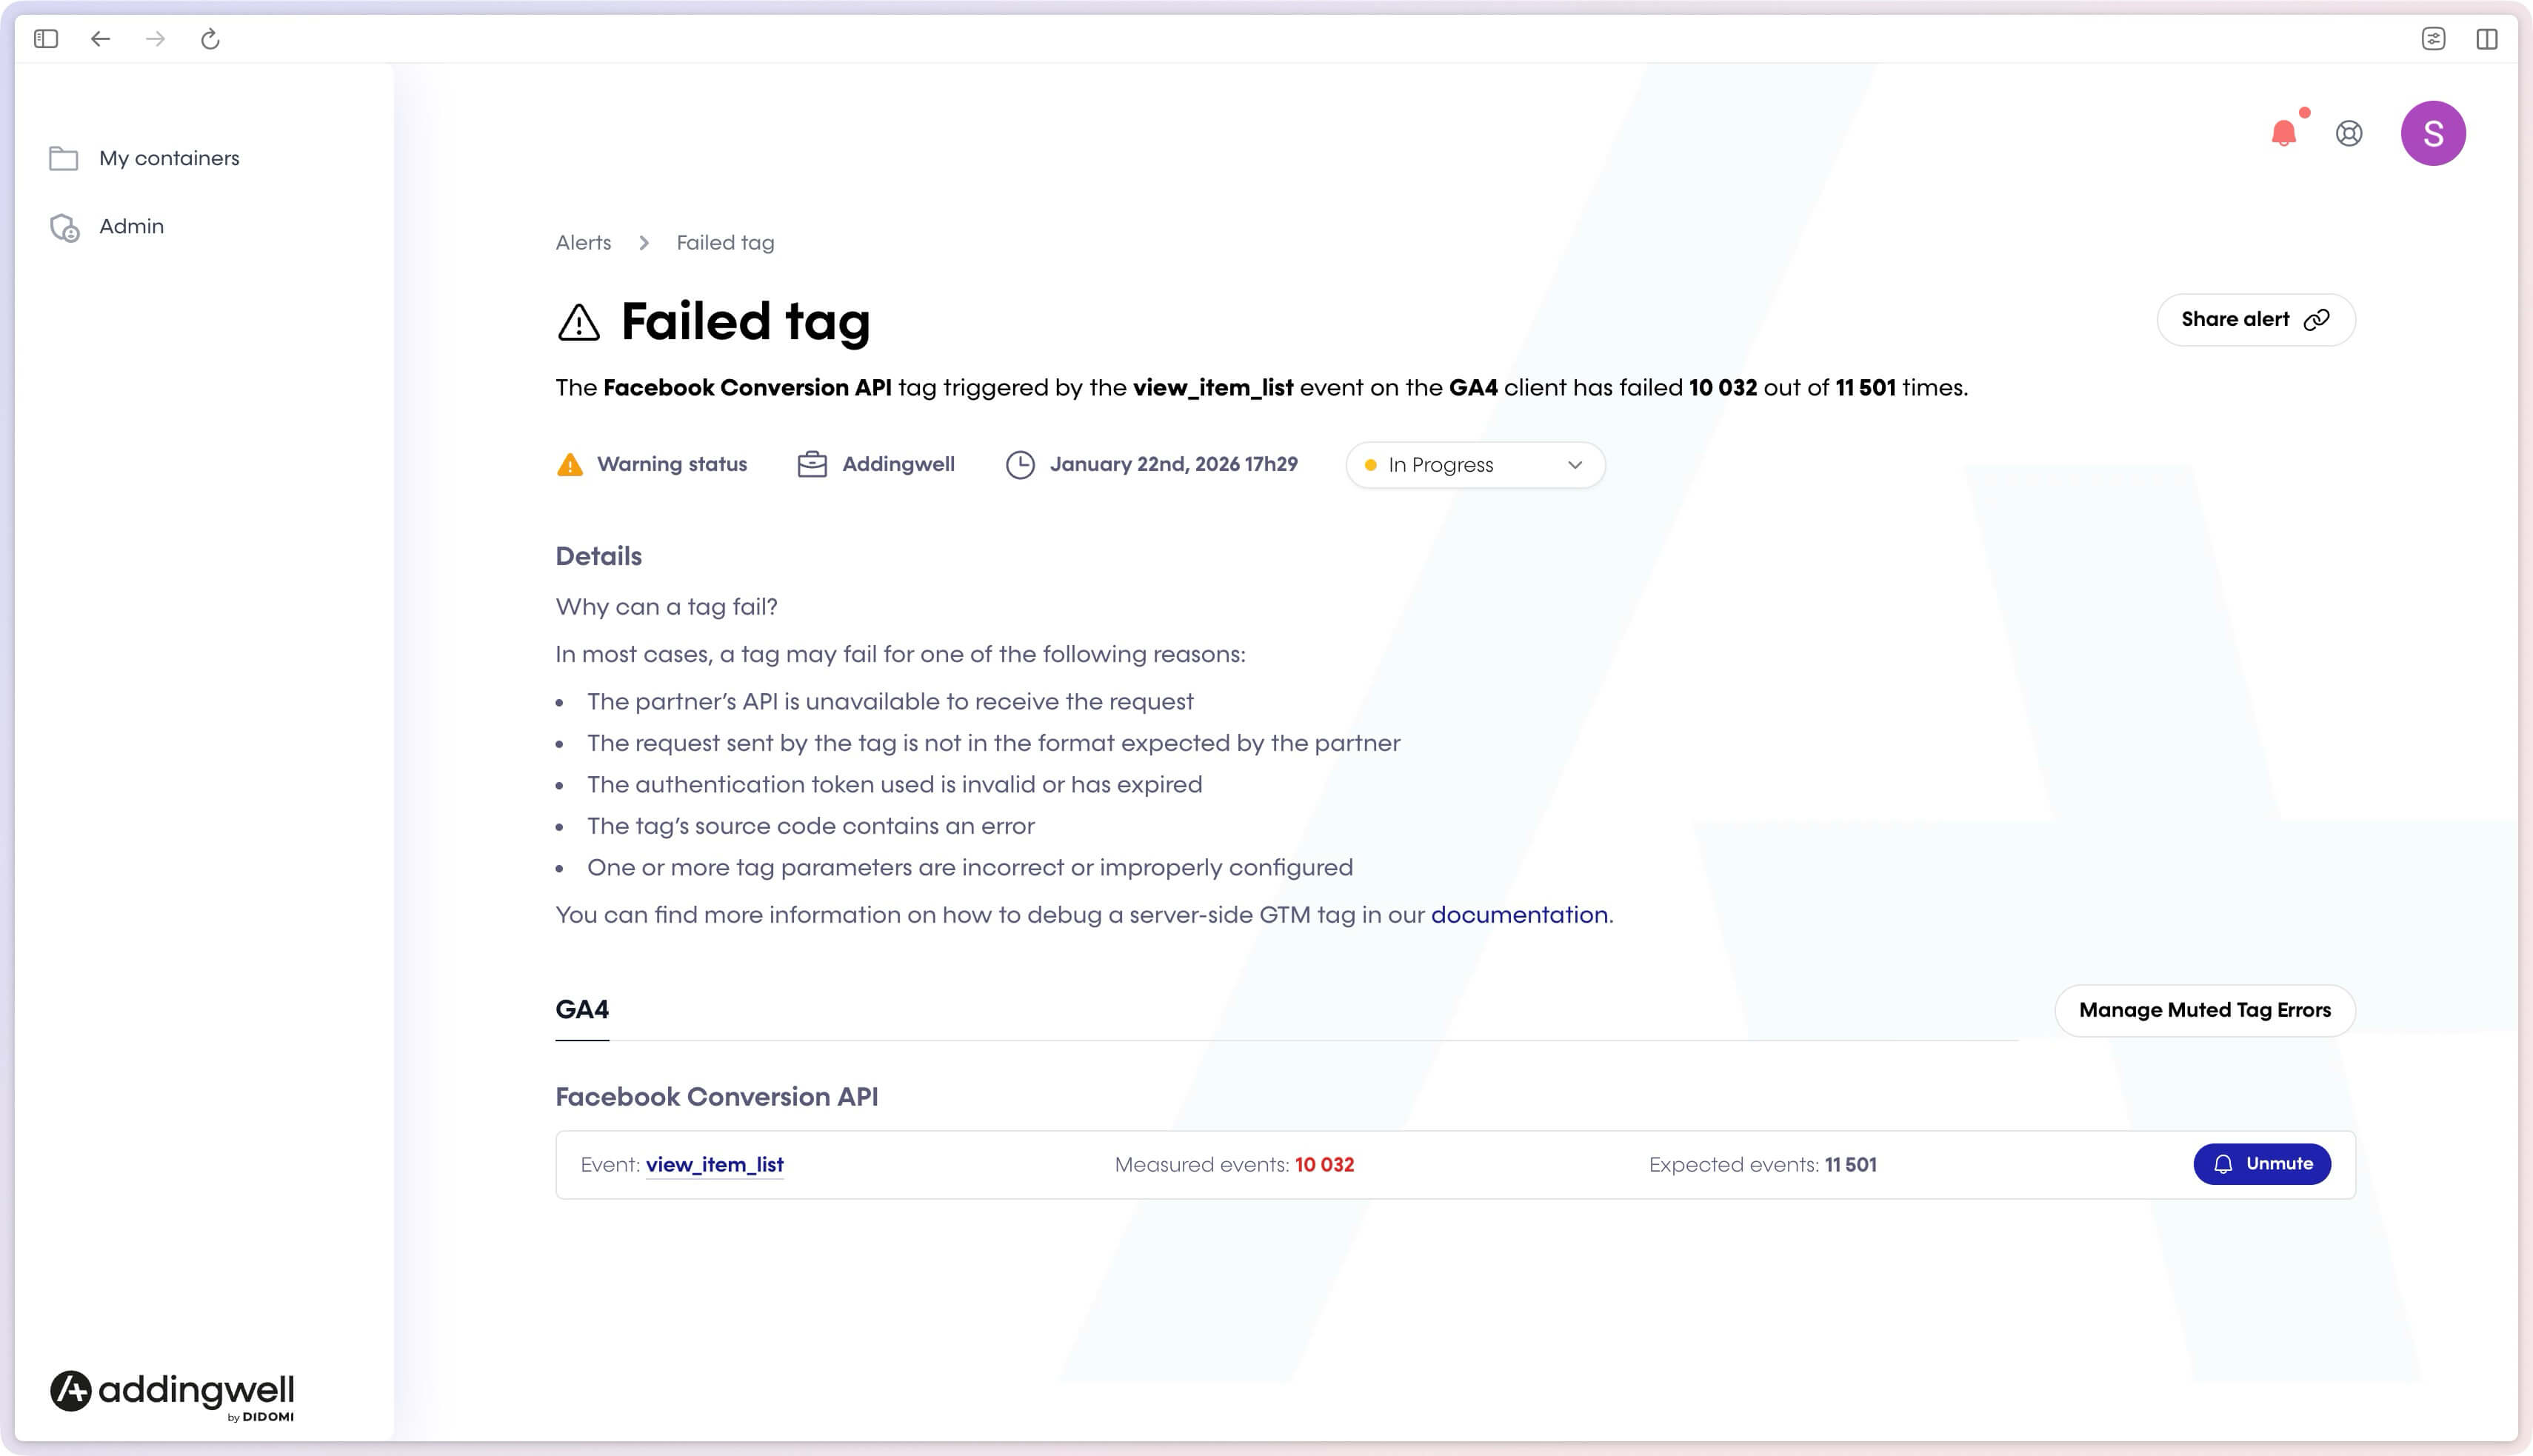
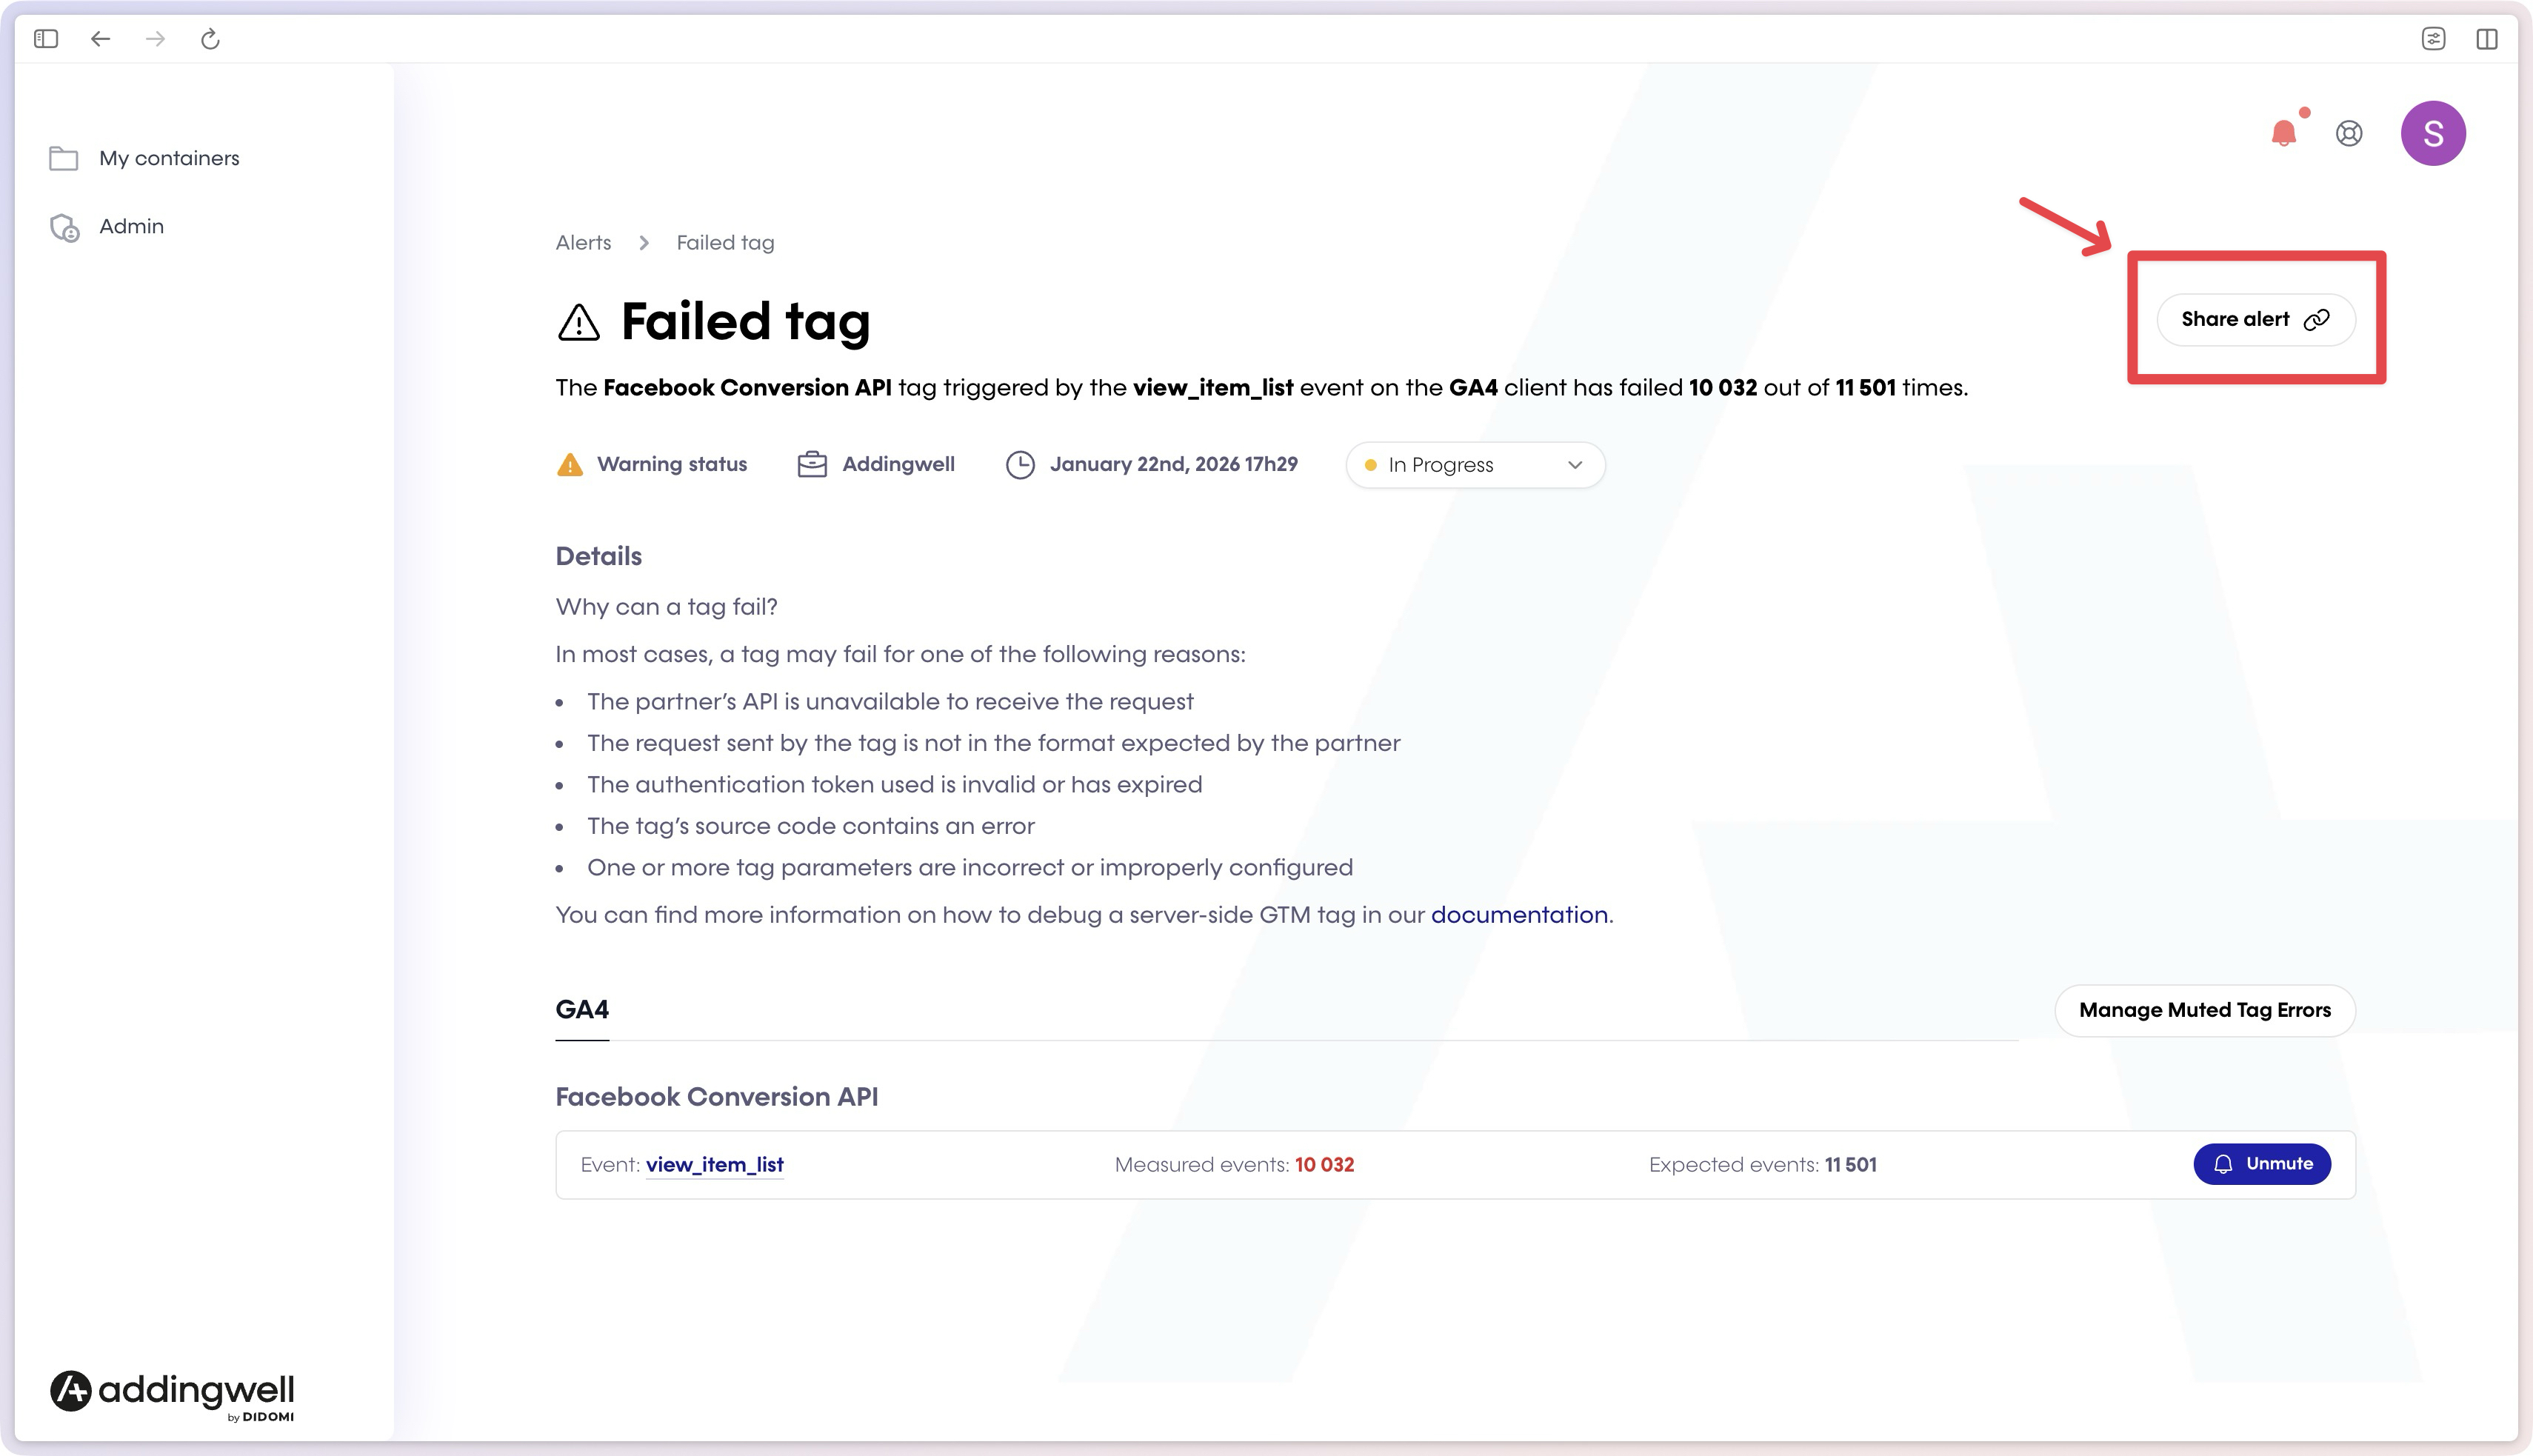
Alert example: Failed tag
This alert indicates that a destination tool (GA4, Meta, etc.) is not receiving events correctly. This can lead to:
- missing conversions,
- discrepancies between your tools,
- decisions based on incomplete data.
The Details section guides you step by step to identify the cause (API unavailable, invalid token, incorrect configuration…).
Share or mute an alert
- Share alert: generate a link to an alert to share it with a colleague or a technical partner.
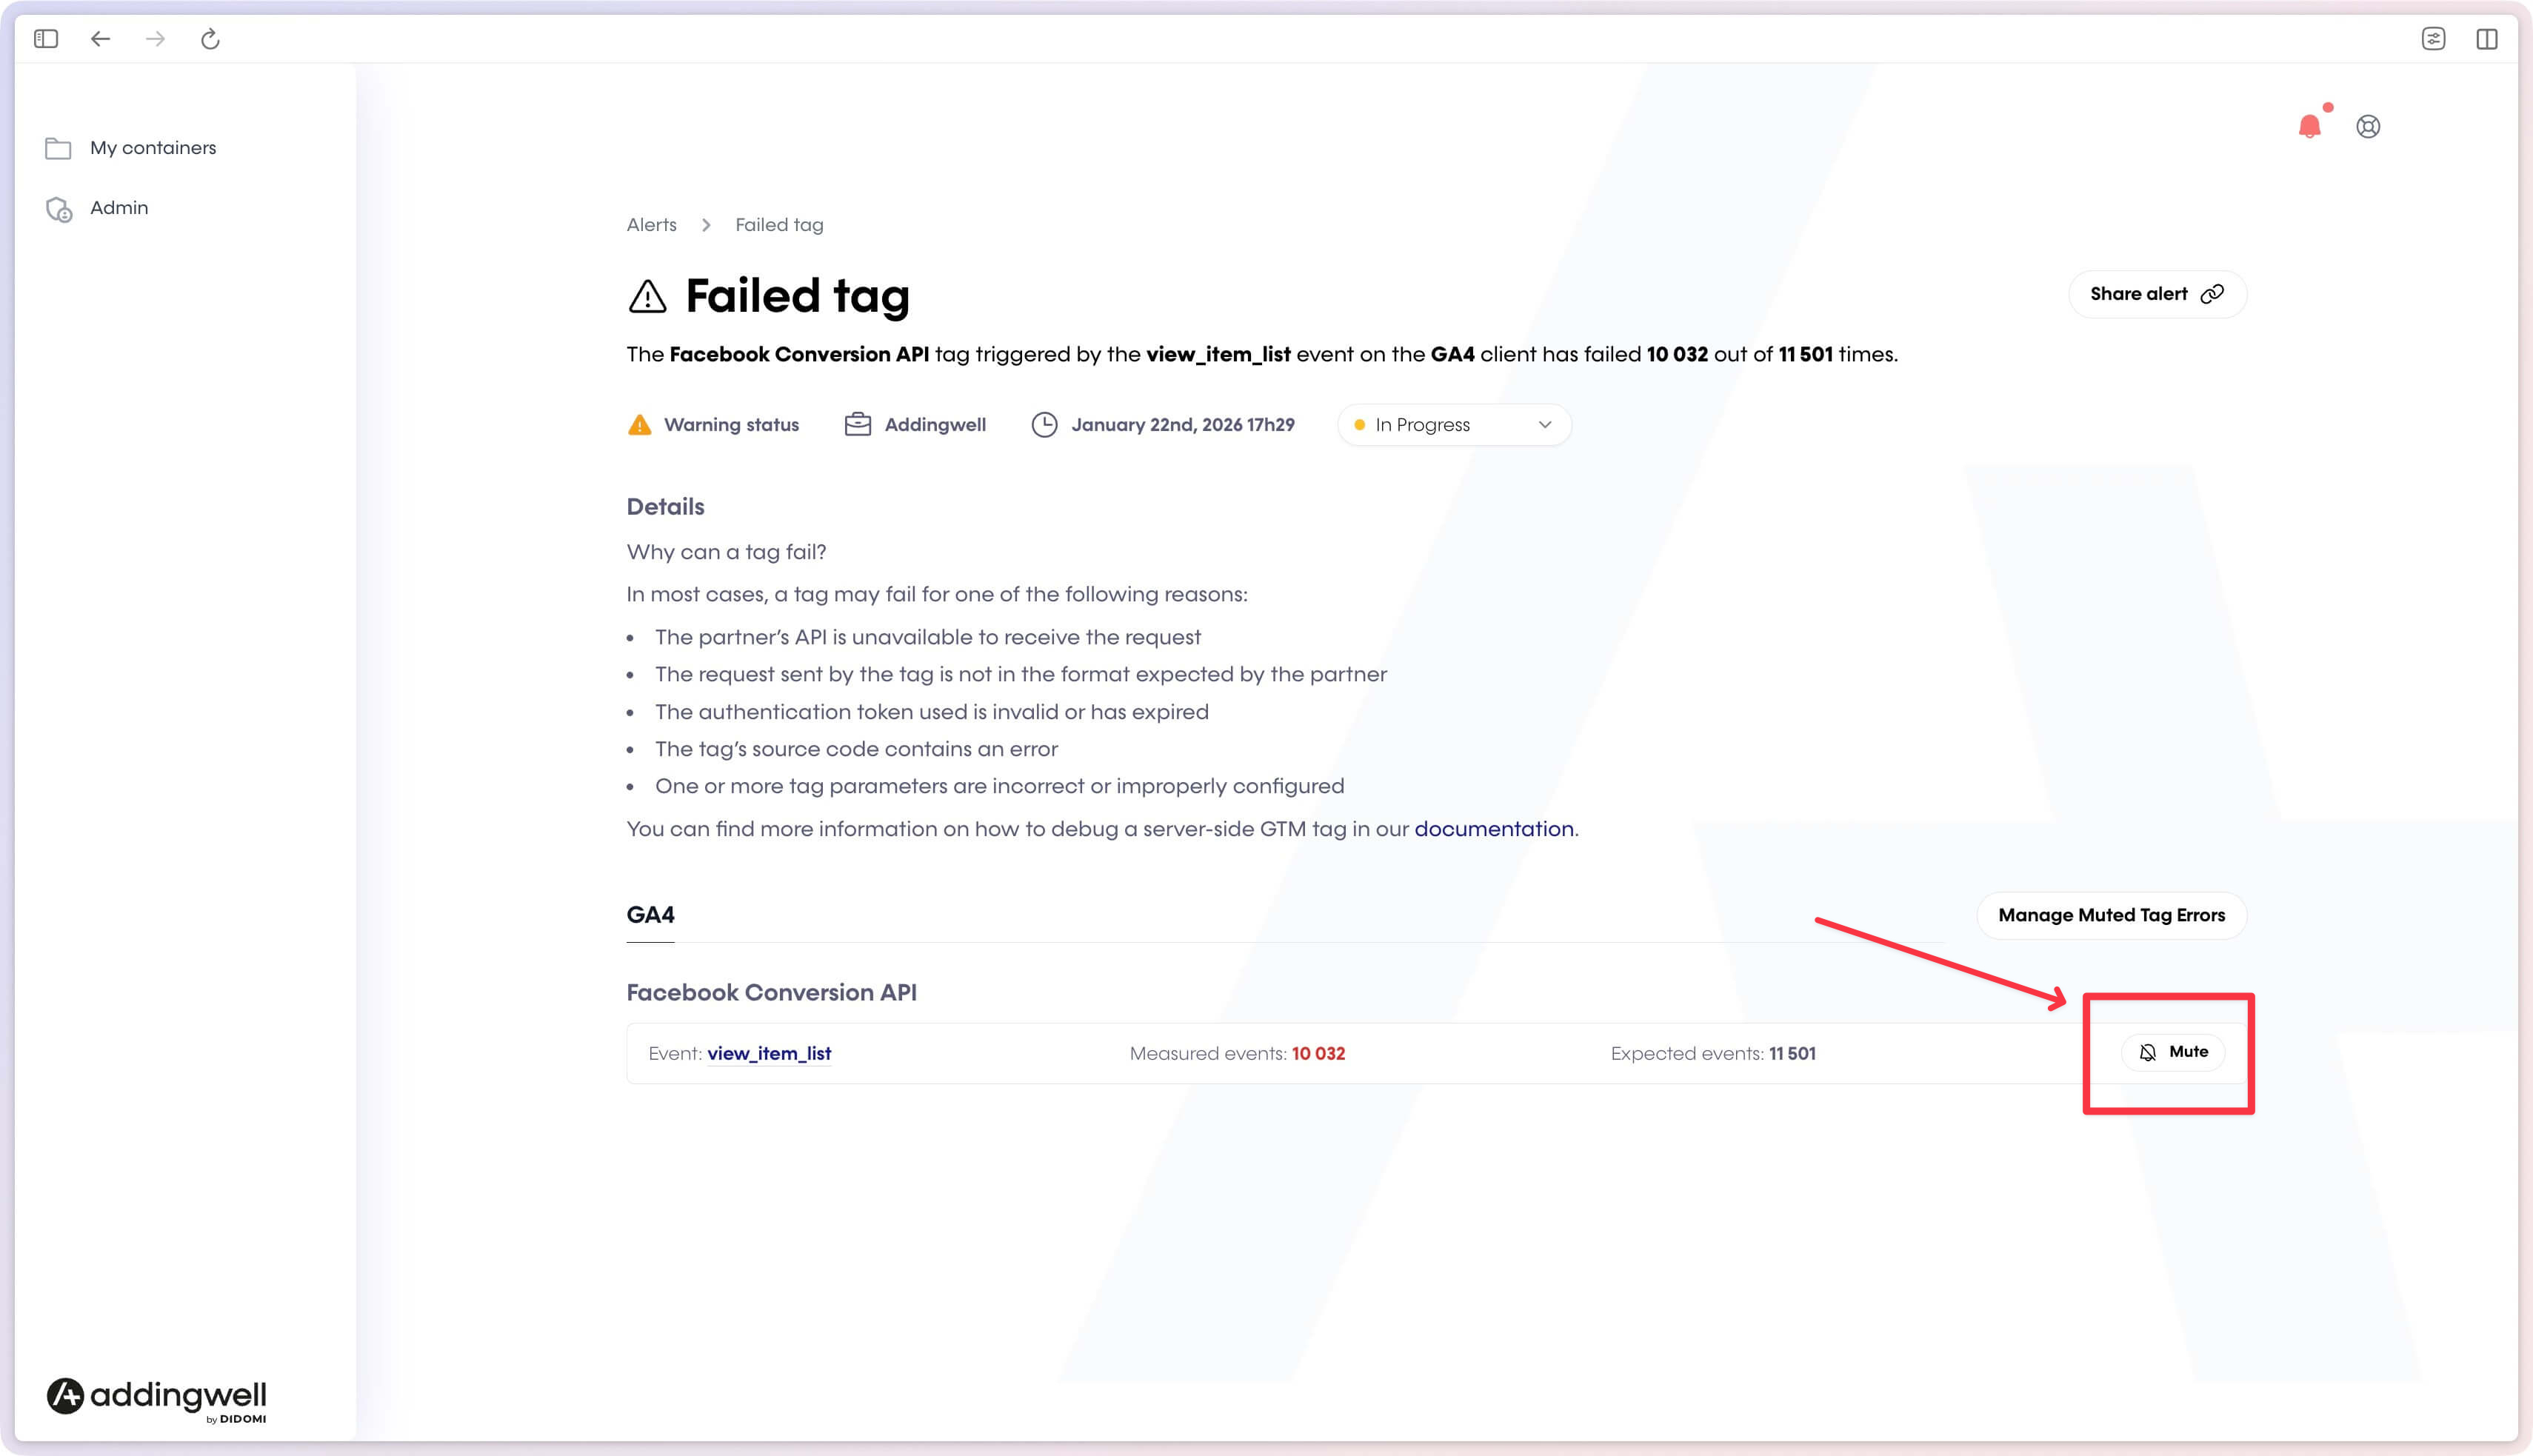
- Mute: mute an alert if it is expected (tests, maintenance) in order to stop receiving associated notifications.
Manage muted errors (Muted Tag Errors)
In the case of Failed tag alerts, some errors may be expected or low priority (implementation tests, non-critical integrations, third-party tool incidents, etc.). To avoid notification fatigue while continuing to monitor everything else, you can mute a specific type of error.
You can manage muted errors:
- From the details of a Failed tag alert, click Mute on the relevant error line.
- To access the full list of muted errors, go to the Manage muted errors page.
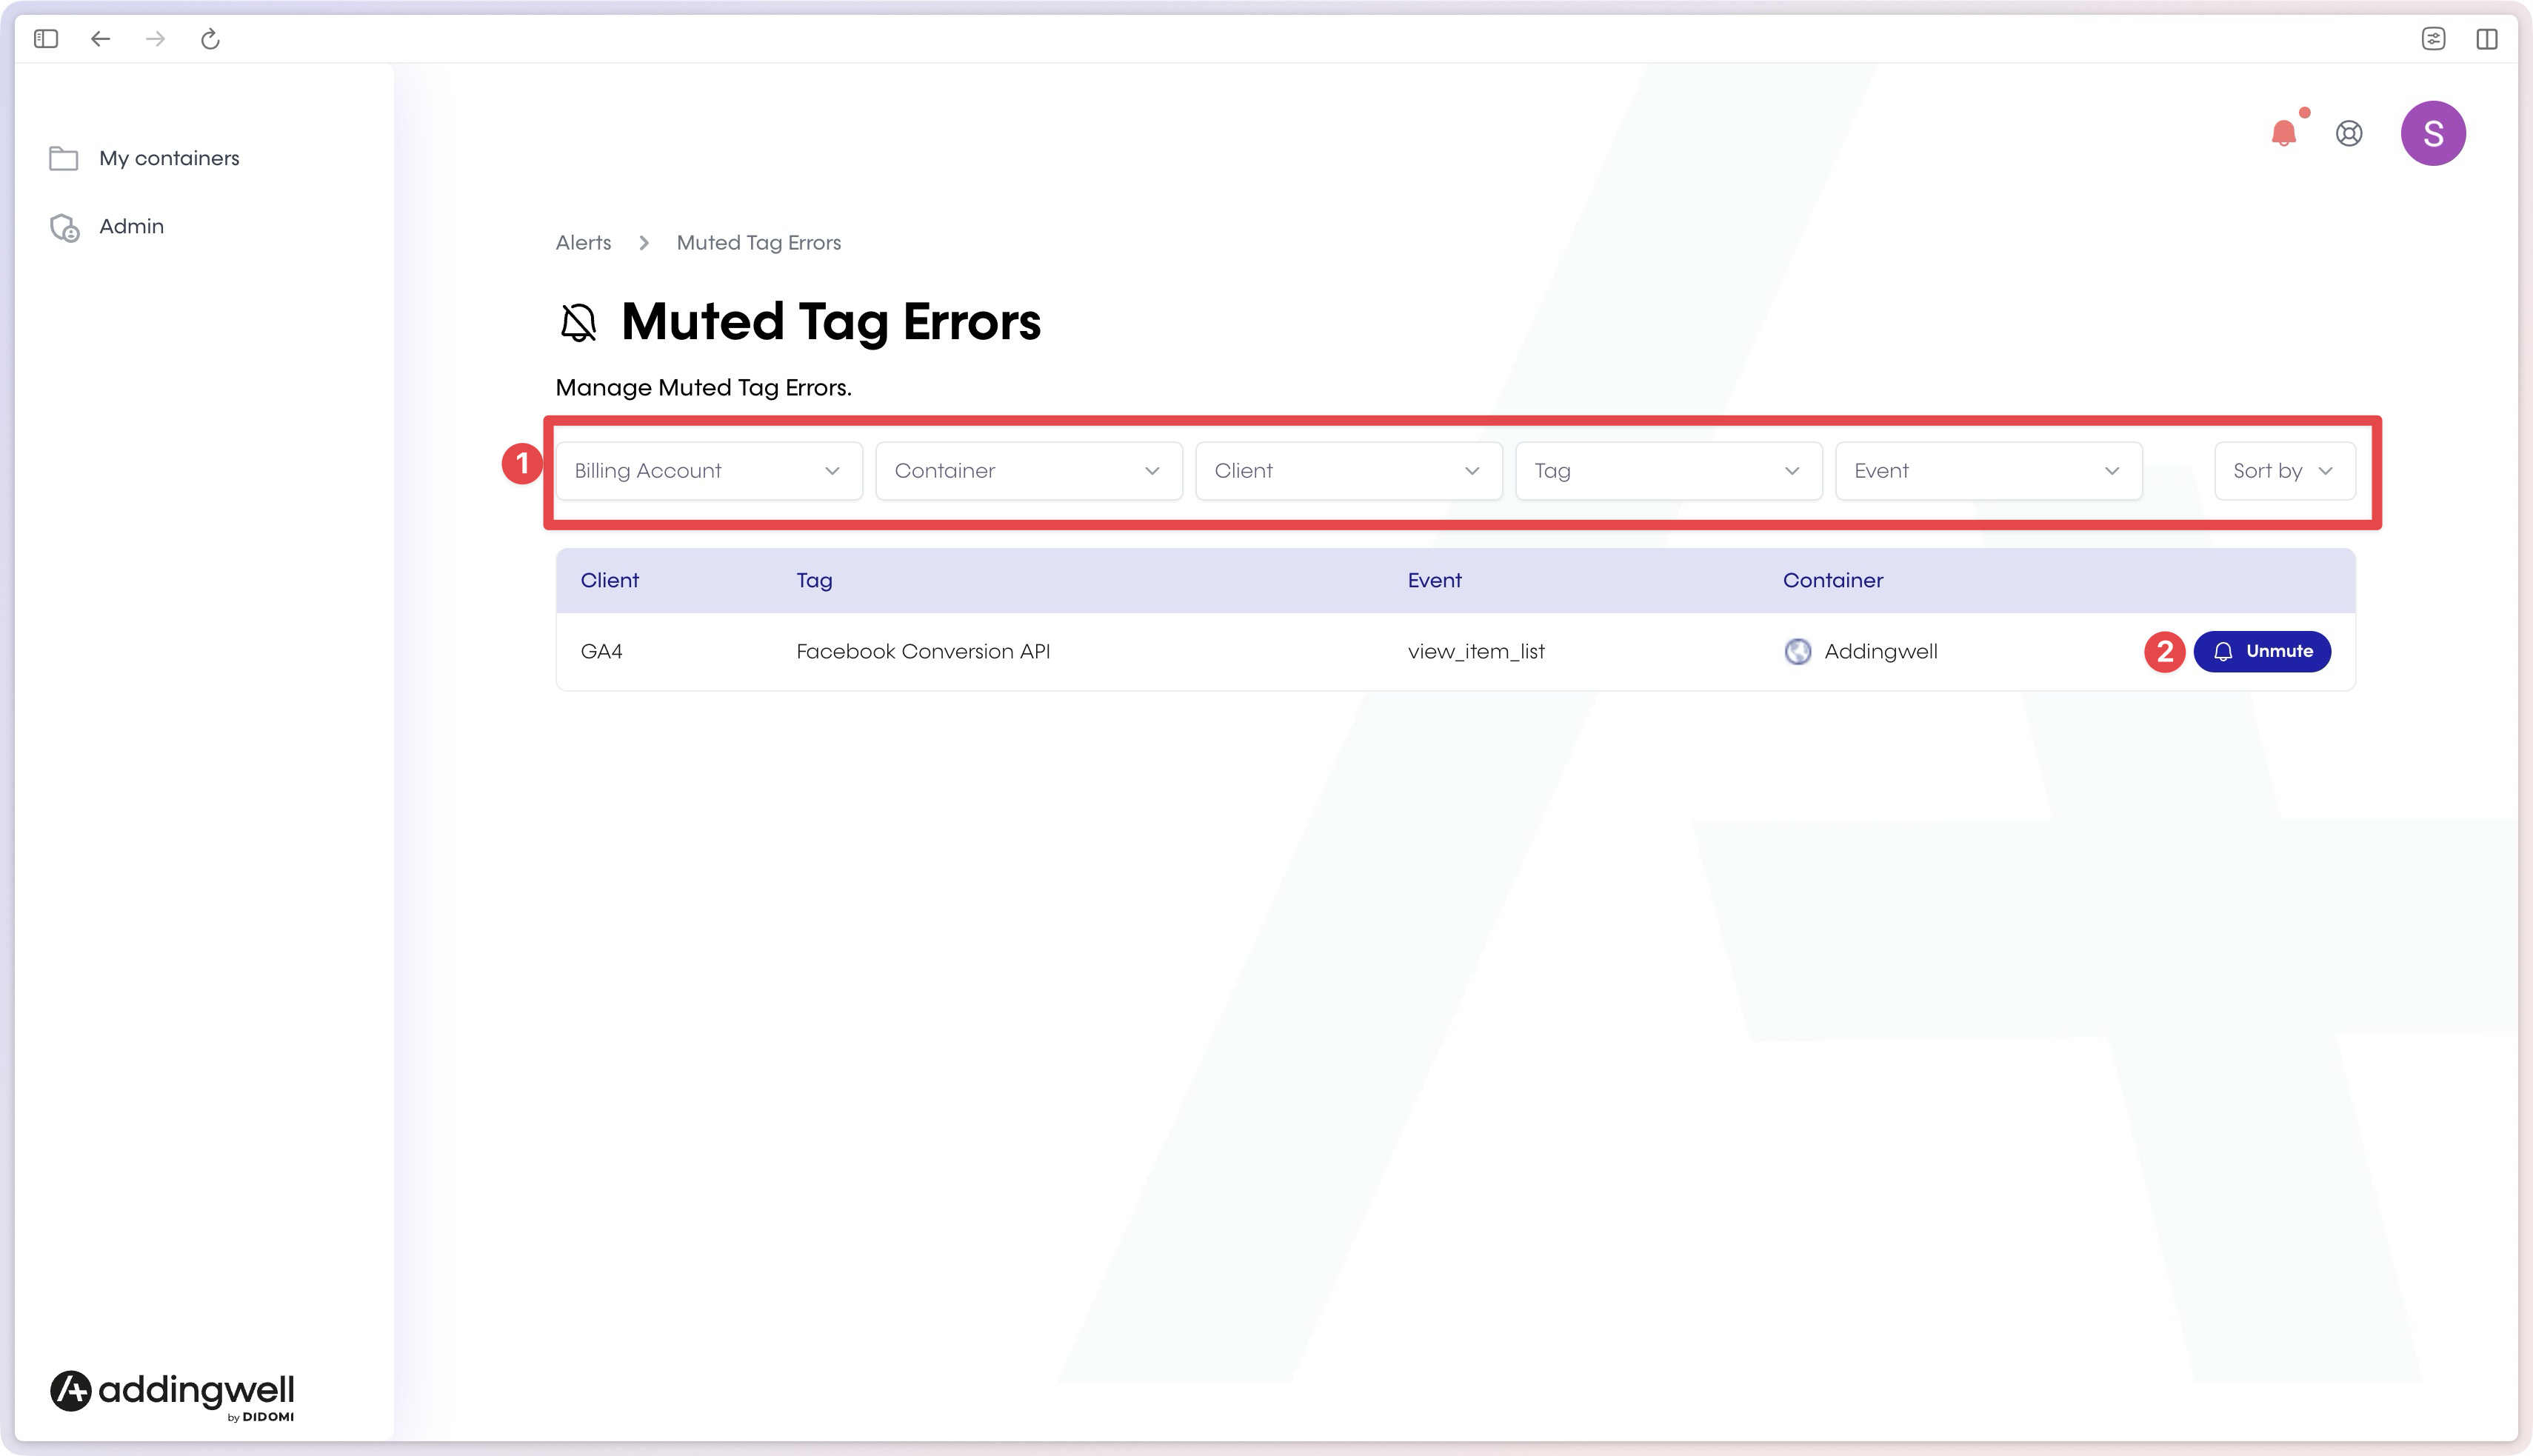
On the Muted Tag Errors page, you can:
- filter by Billing account, Container, Client, Tag, and Event (1),
- reactivate an error at any time using Unmute (2).
Important: a Failed tag alert will not send a notification if it contains only muted errors. As soon as a new non-muted error appears, the notification is sent.
Manage notification preferences
Alerts are only useful if you receive the right notifications at the right time.
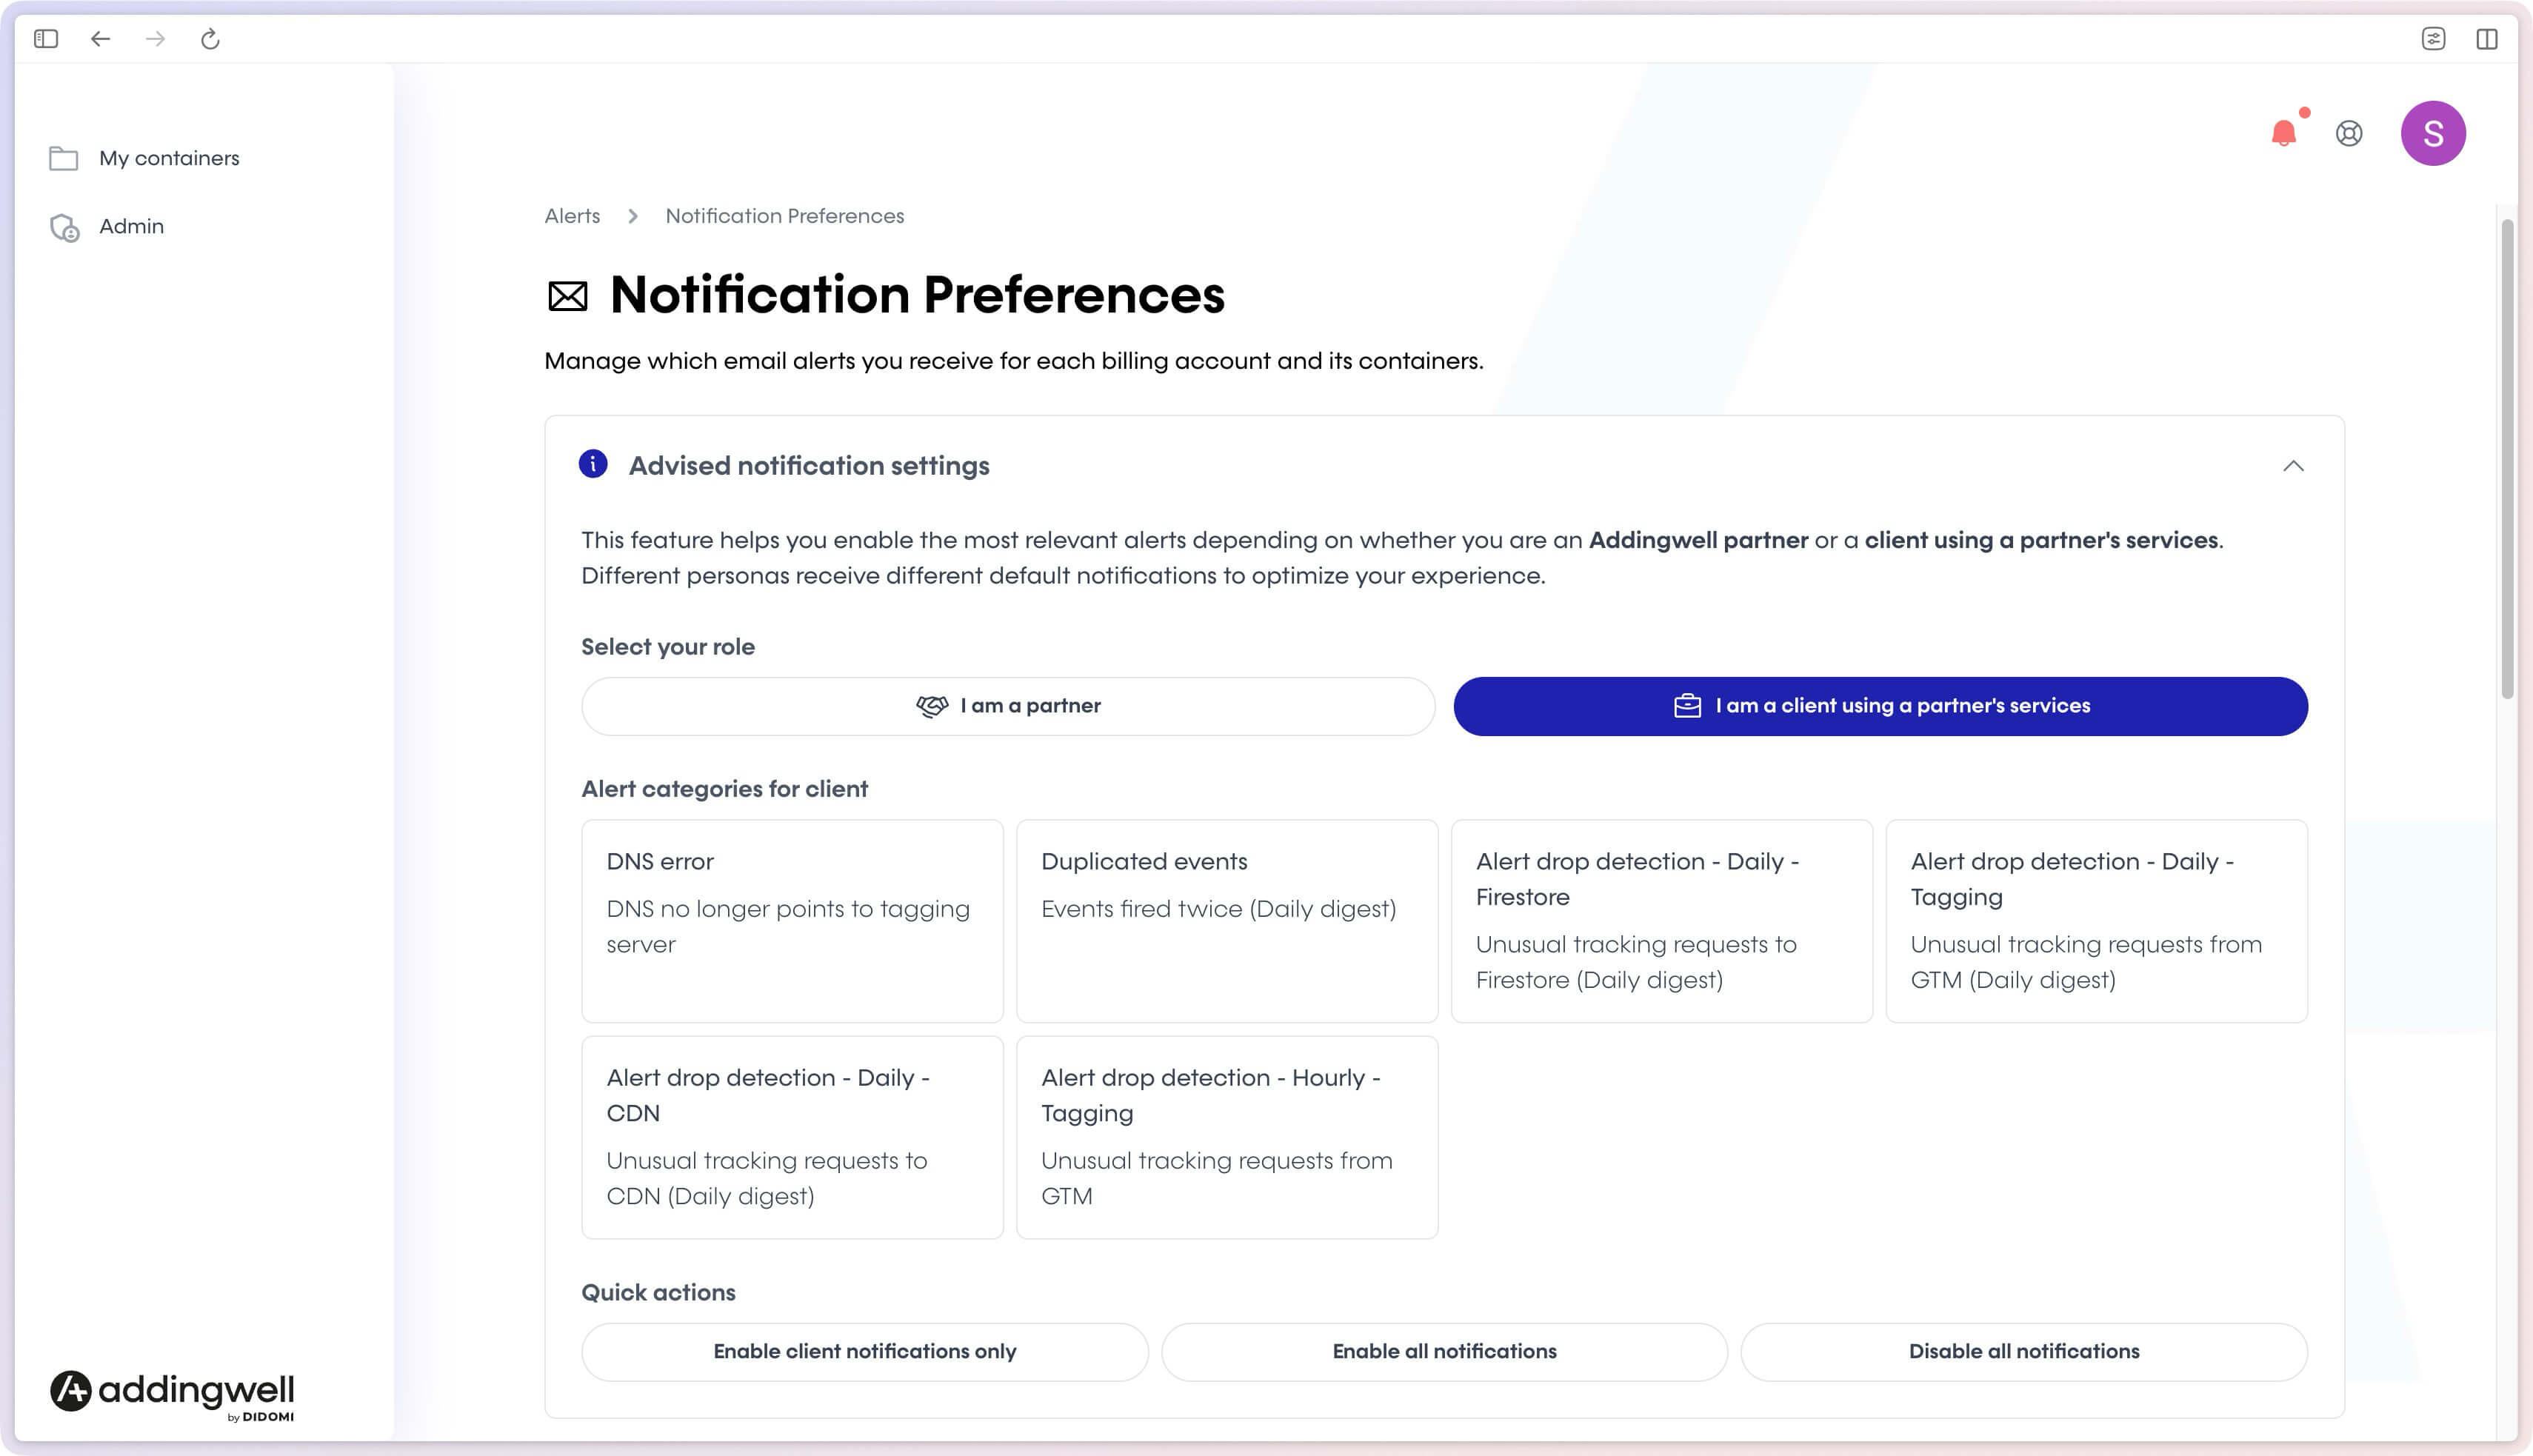
The Notification Preferences page allows you to precisely control which alerts are sent by email.
Recommended settings
Addingwell offers recommended settings based on your role:
- Addingwell Partner
- Client using a partner’s services
These settings automatically enable the most relevant alerts for your profile, helping you avoid notification overload while staying informed about critical incidents.
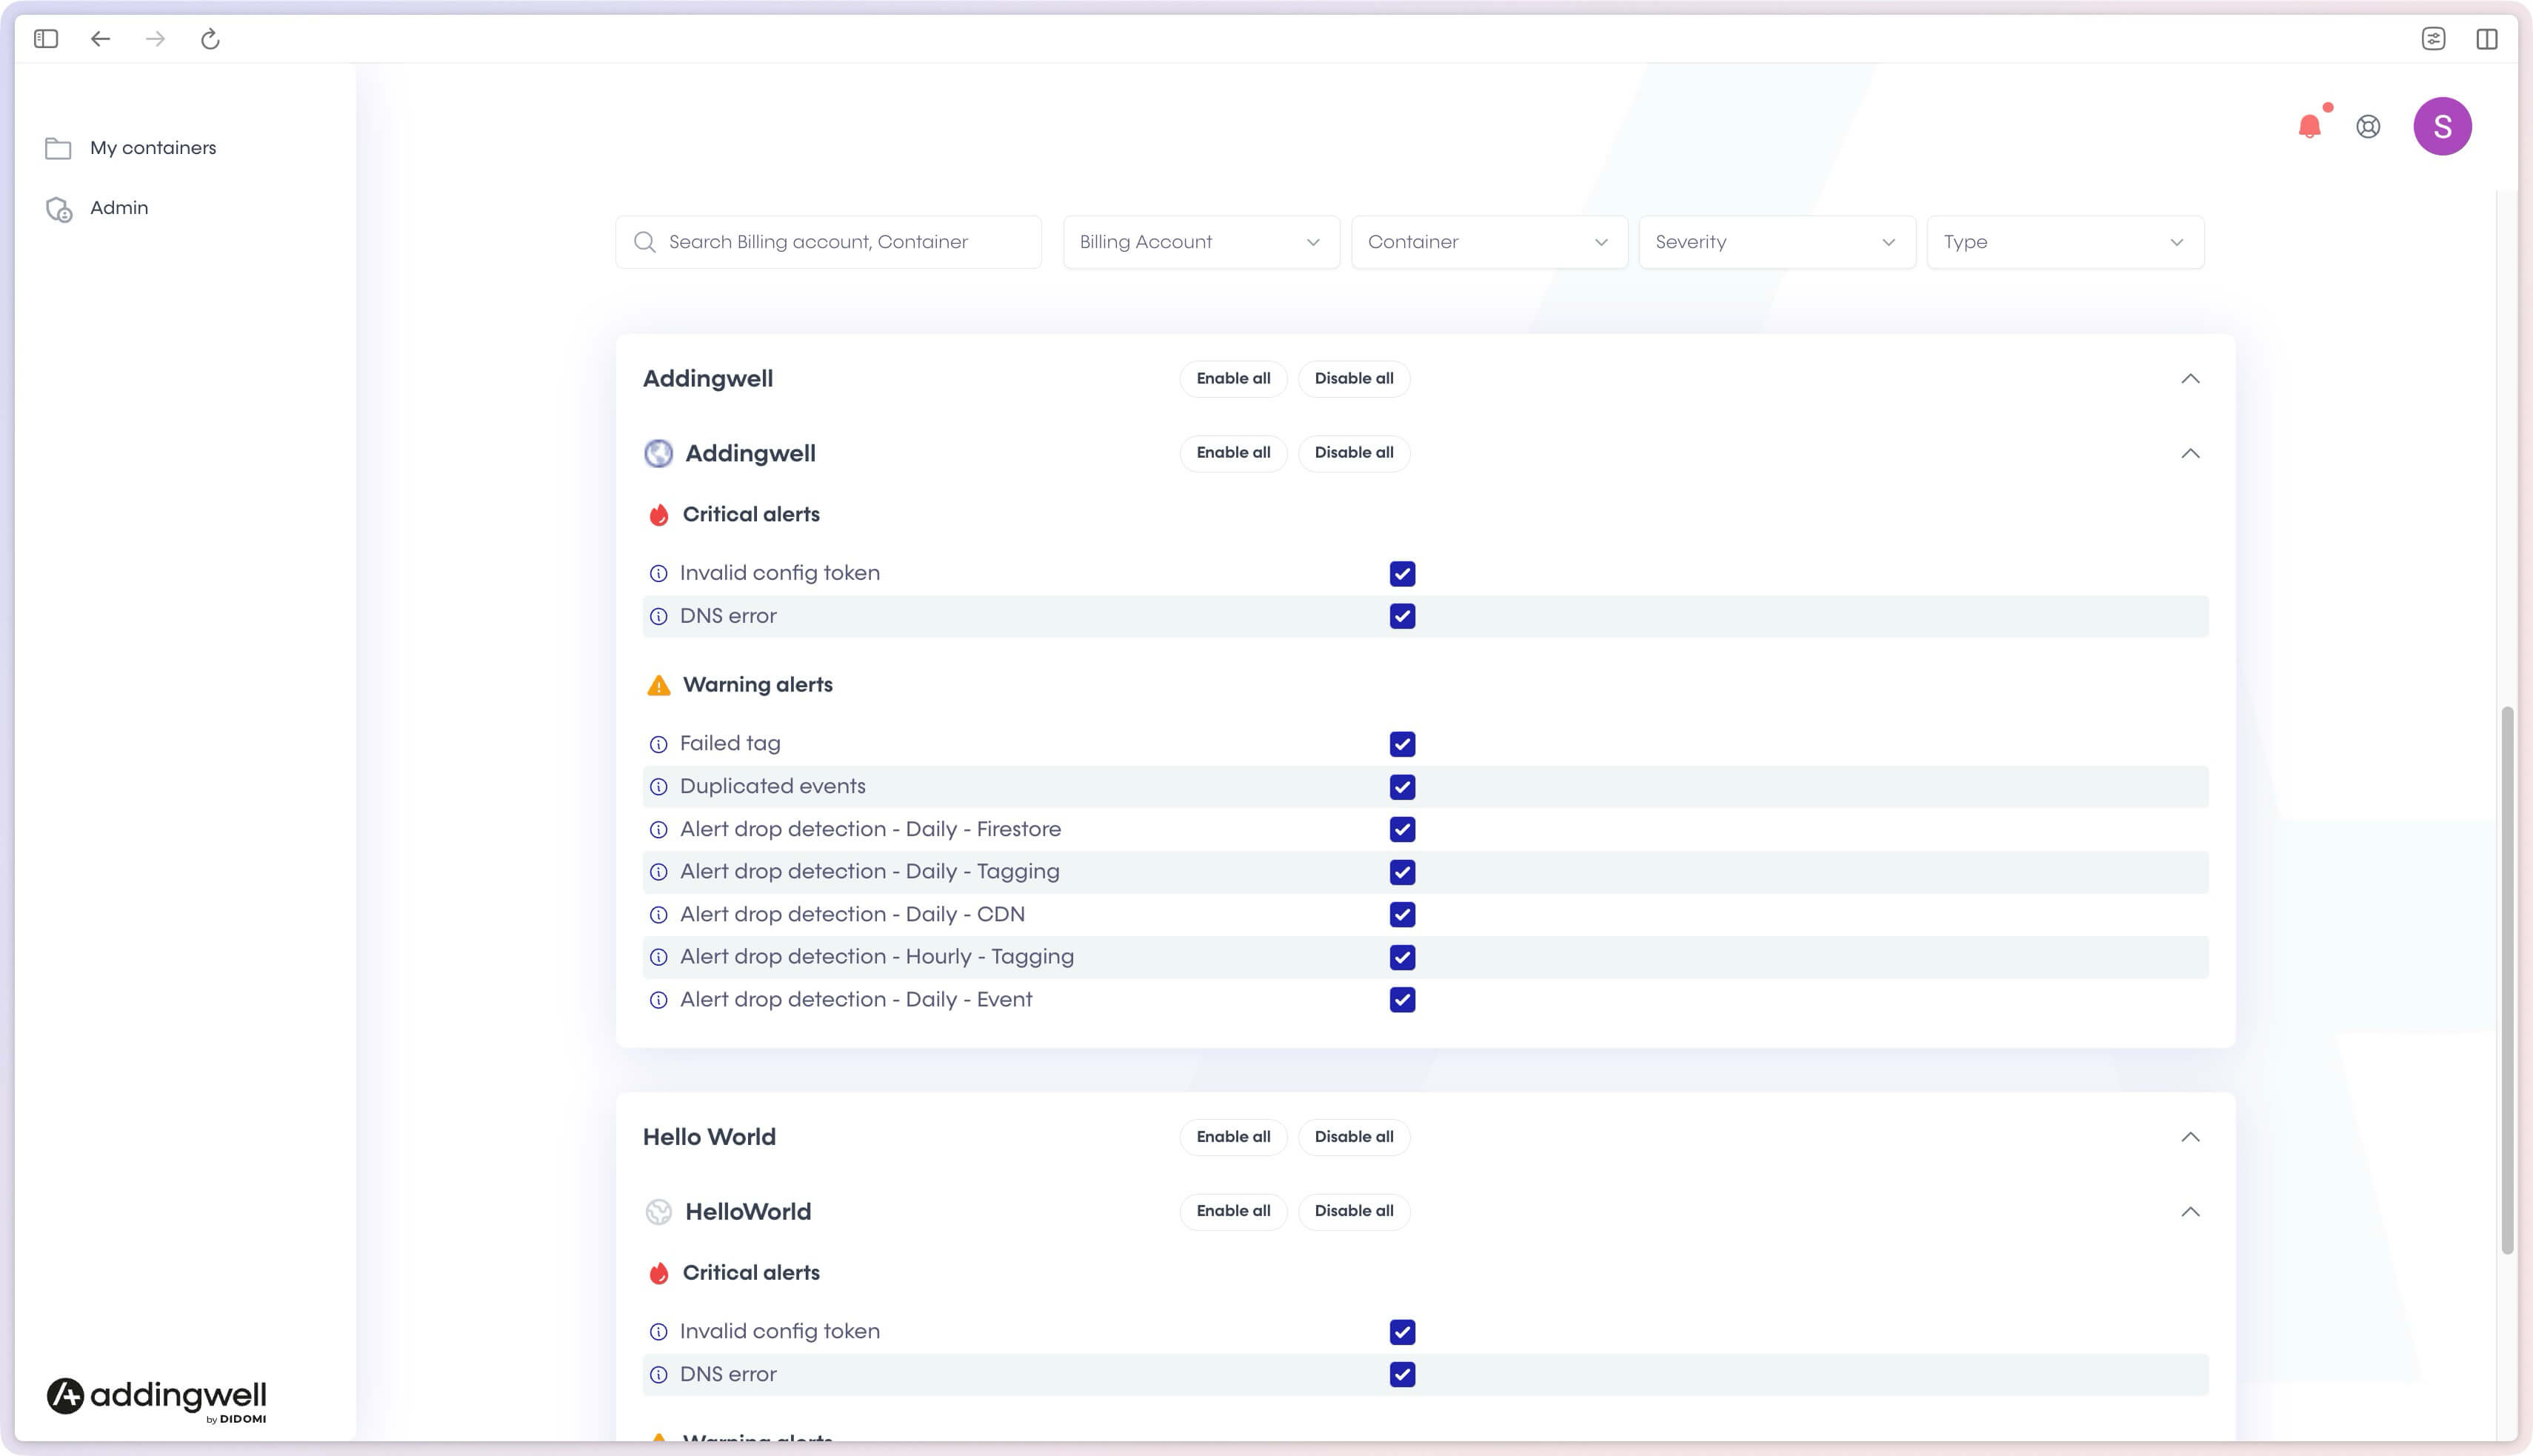
Custom configuration
You can fine-tune notifications:
- by billing account,
- by container,
- by priority level,
- by alert type.
Quick actions are available:
- Enable all notifications
- Disable all notifications
These settings allow you to adapt alerting to your organization and your level of technical involvement.
Summary
The Addingwell alerting center helps you quickly detect tracking issues, act before your data is impacted, and stay in control, without requiring advanced technical skills.